In the last post, I used the Logstash dns filter to translate remote server IP addresses into recognisable domain names. In this post, I will look to perform a similar operation for local IP addresses in order to translate them into recognisable device names.
translating local ip addresses to device names
While in the last post we could use the dns filter to perform a reverse dns lookup to resolve a remote domain name for an IP address, this is not possible with local IP addresses. Fortunately, I have two key tools that I can use to perform a similar operation:
- While my router behaves as a DHCP server, it has a feature that allows it to always allocate the same IP address to a given MAC address. Therefore I know a given device will always have a specific IP address.
- Logstash provides the
translatefilter which allows you to map from one value to another via a dictionary lookup.
With my routers "Bind IP to MAC" function set up, I will author a new yaml file that meets the specifications outlined in the translate filter documentation. It looks like this:
192.168.1.3: TPLink Range Extender
192.168.1.9: Ricoh Printer
192.168.1.10: Server A
192.168.1.21: PC A
I'll name this file IPLookup.yaml and save it besides the syslog.config file. Next I need to add additional filters to syslog.config which now looks as follows:
input {
  tcp {
    port => 5000
    type => syslog
  }
  udp {
    port => 5000
    type => syslog
  }
}

filter {
    grok {
        match => [ "message", "<%{POSINT:syslog_pri}>%{SYSLOGTIMESTAMP:syslog_timestamp} Vigor\: Local User \(MAC=%{MAC:source_mac}\): %{IP:source_address}(?::%{POSINT:source_port})? -> %{IP:destination_address}(?::%{POSINT:destination_port})? \((?<protocol>TCP|UDP)\)" ]
        add_tag => "access"
    }
    if "access" in [tags] {
        mutate {
            add_field => {
              "source_host" => "%{[source_address]}"
              "destination_host" => "%{[destination_address]}"
            }
        }
        dns {
            reverse => [ "destination_host" ]
            action => "replace"
            nameserver => "192.168.1.1"
        }
        translate {
            destination => "source_host"
            dictionary_path => "config\IPLookup.yaml"
            fallback => "%{source_address}"
            field => "source_address"
            override => true
        }
    }
}

output {
  elasticsearch {
    hosts => ["192.168.1.30:9200"]
    index => "syslog-%{+YYYY.MM.dd}"
  }
}
Note the translate filter where I lookup the source_address field in the IPLookup.yaml file and put the result in the source_host field. If not found, the fallback value instructs the filter to output the source_address into the source_host field. The override value is set to true as the source_host field is added in the mutate filter above as a fail-safe.
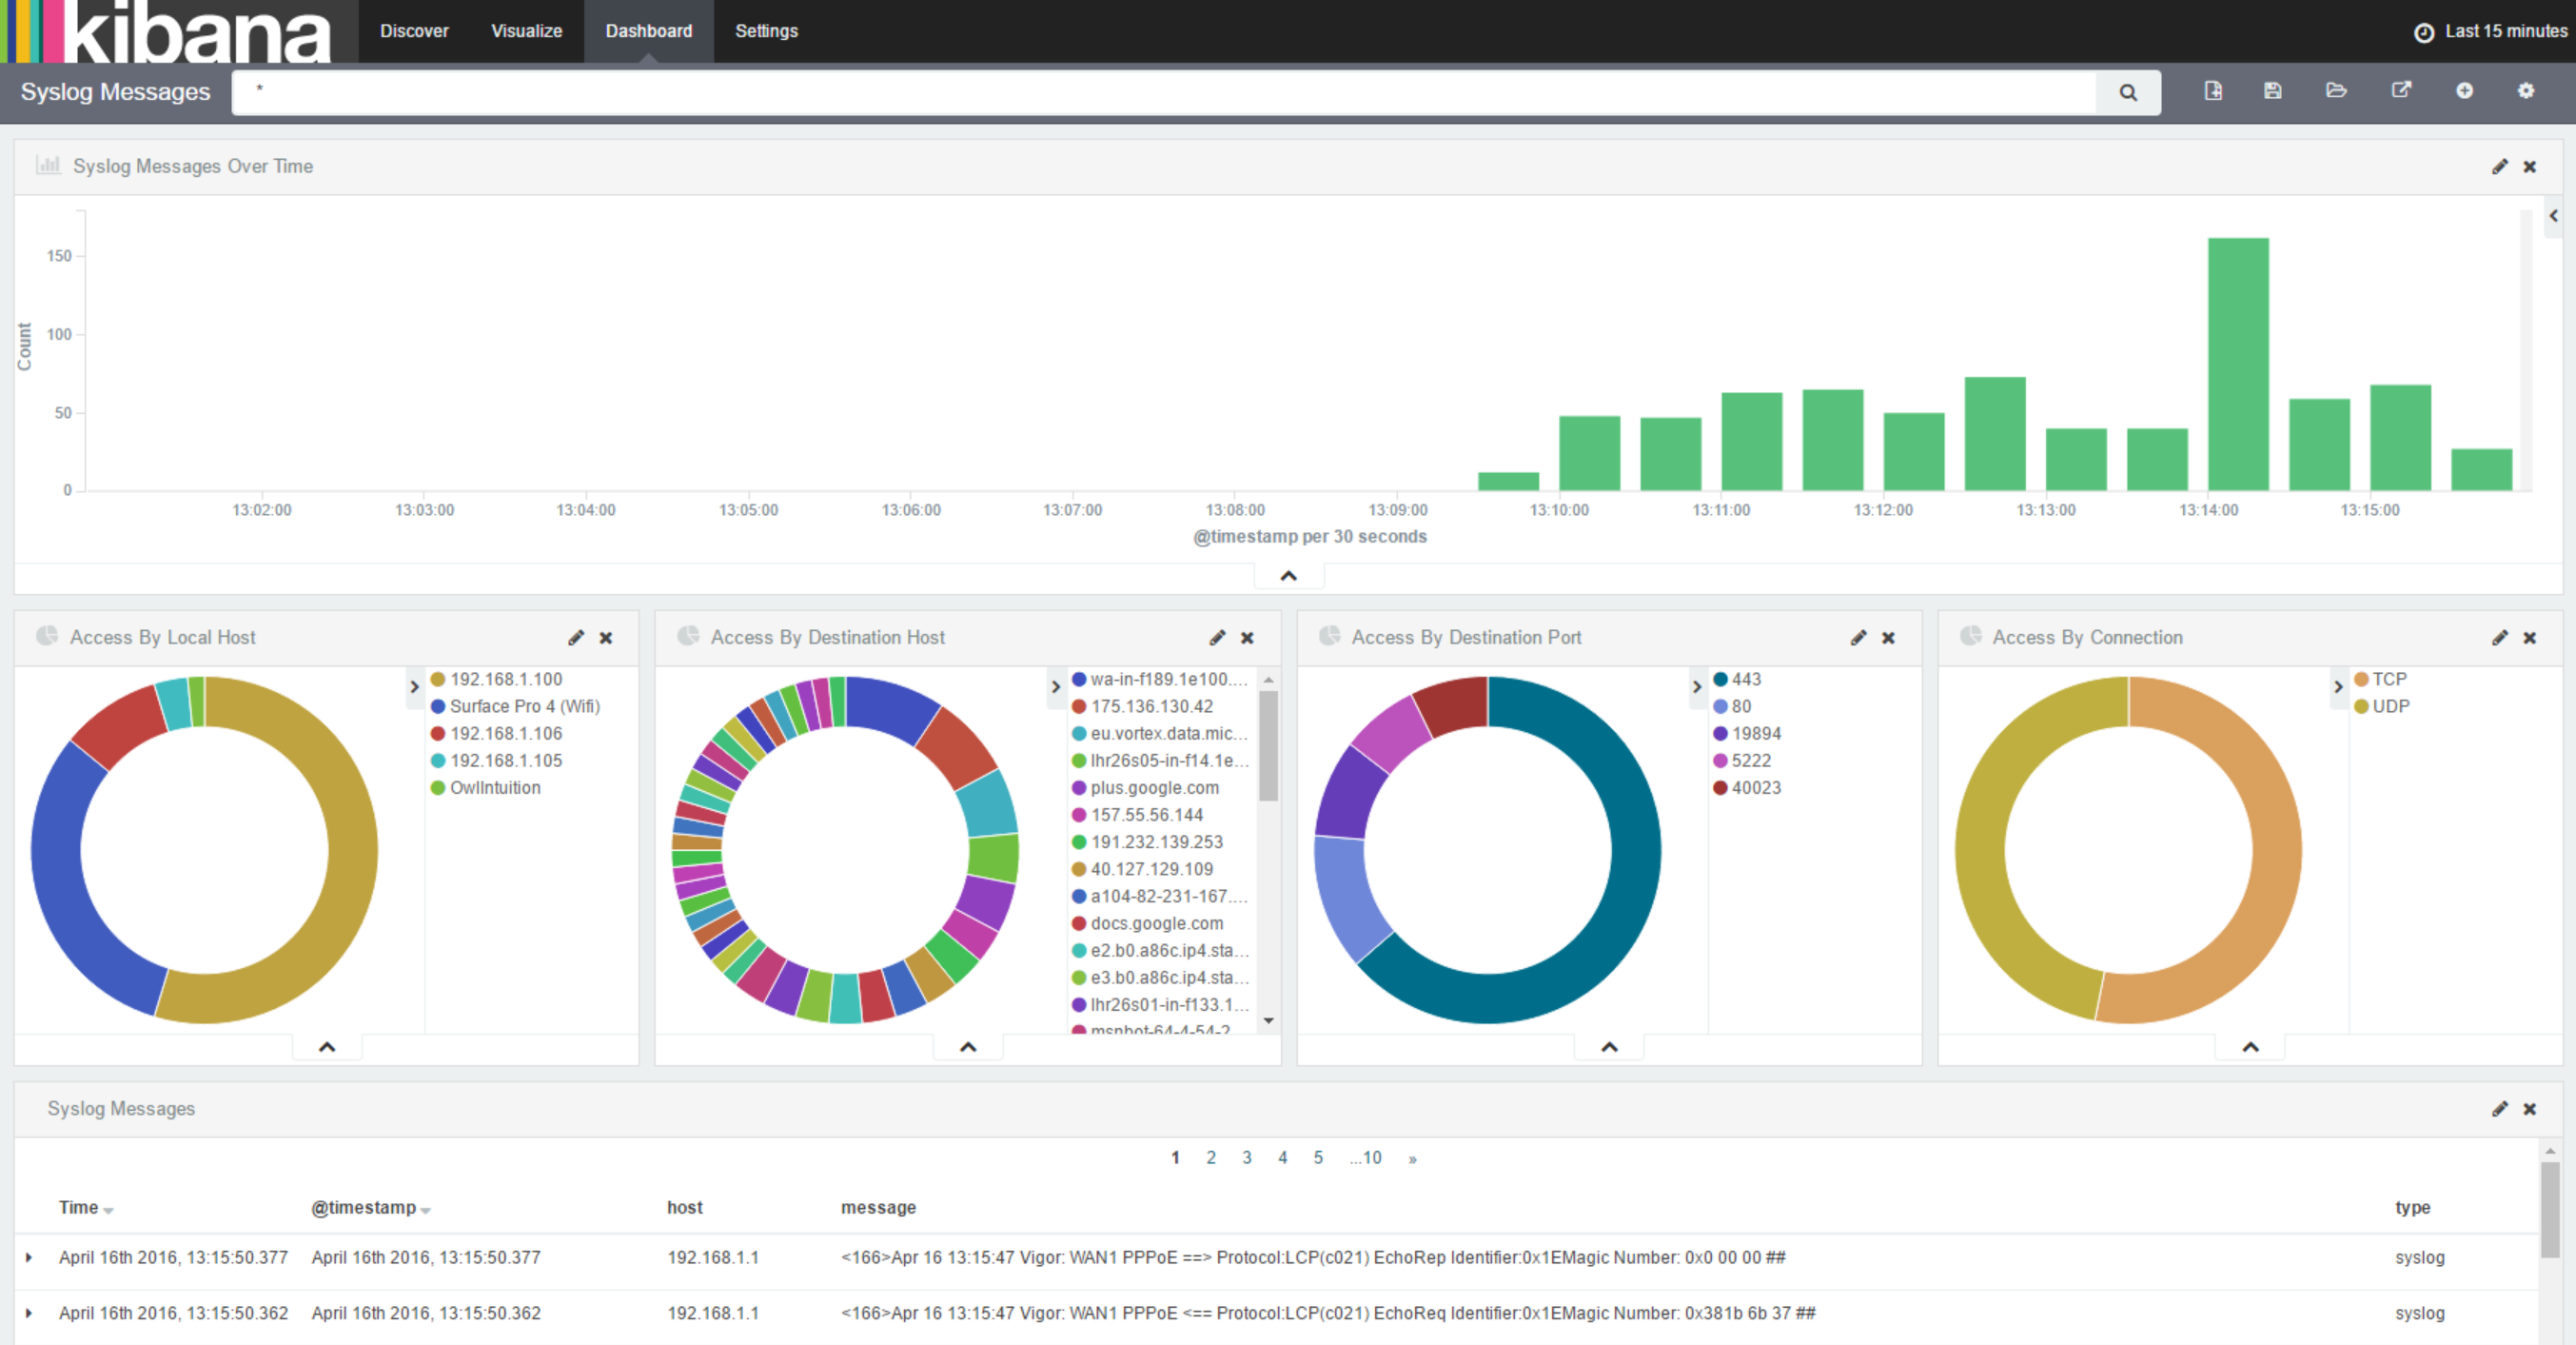
With the changes to configuration in place, I once again restart Logstash. Once a syslog message has been received, I get the mapping from ElasticSearch and update it to mark the local_host field as not_analyzed. Then, in Kibana, I refresh the field list for the 'syslog-*' index, add 'local_host' to the 'Syslog Messages' saved search, load 'Access By Local Address' visualization and modify it to use 'local_host' rather than the 'local_address' field and save it as 'Access By Local Host'. Finally, I replace this visualization on my dashboard and get the following:
further mappings
Now I've got the translation of local IP addresses to names working, I'm going to add a few more translations for:
- IP Address to Operating System
- IP Address to Wired/WiFi connection
- TCP and UDP Port to Protocol (using a CSV from IANA)
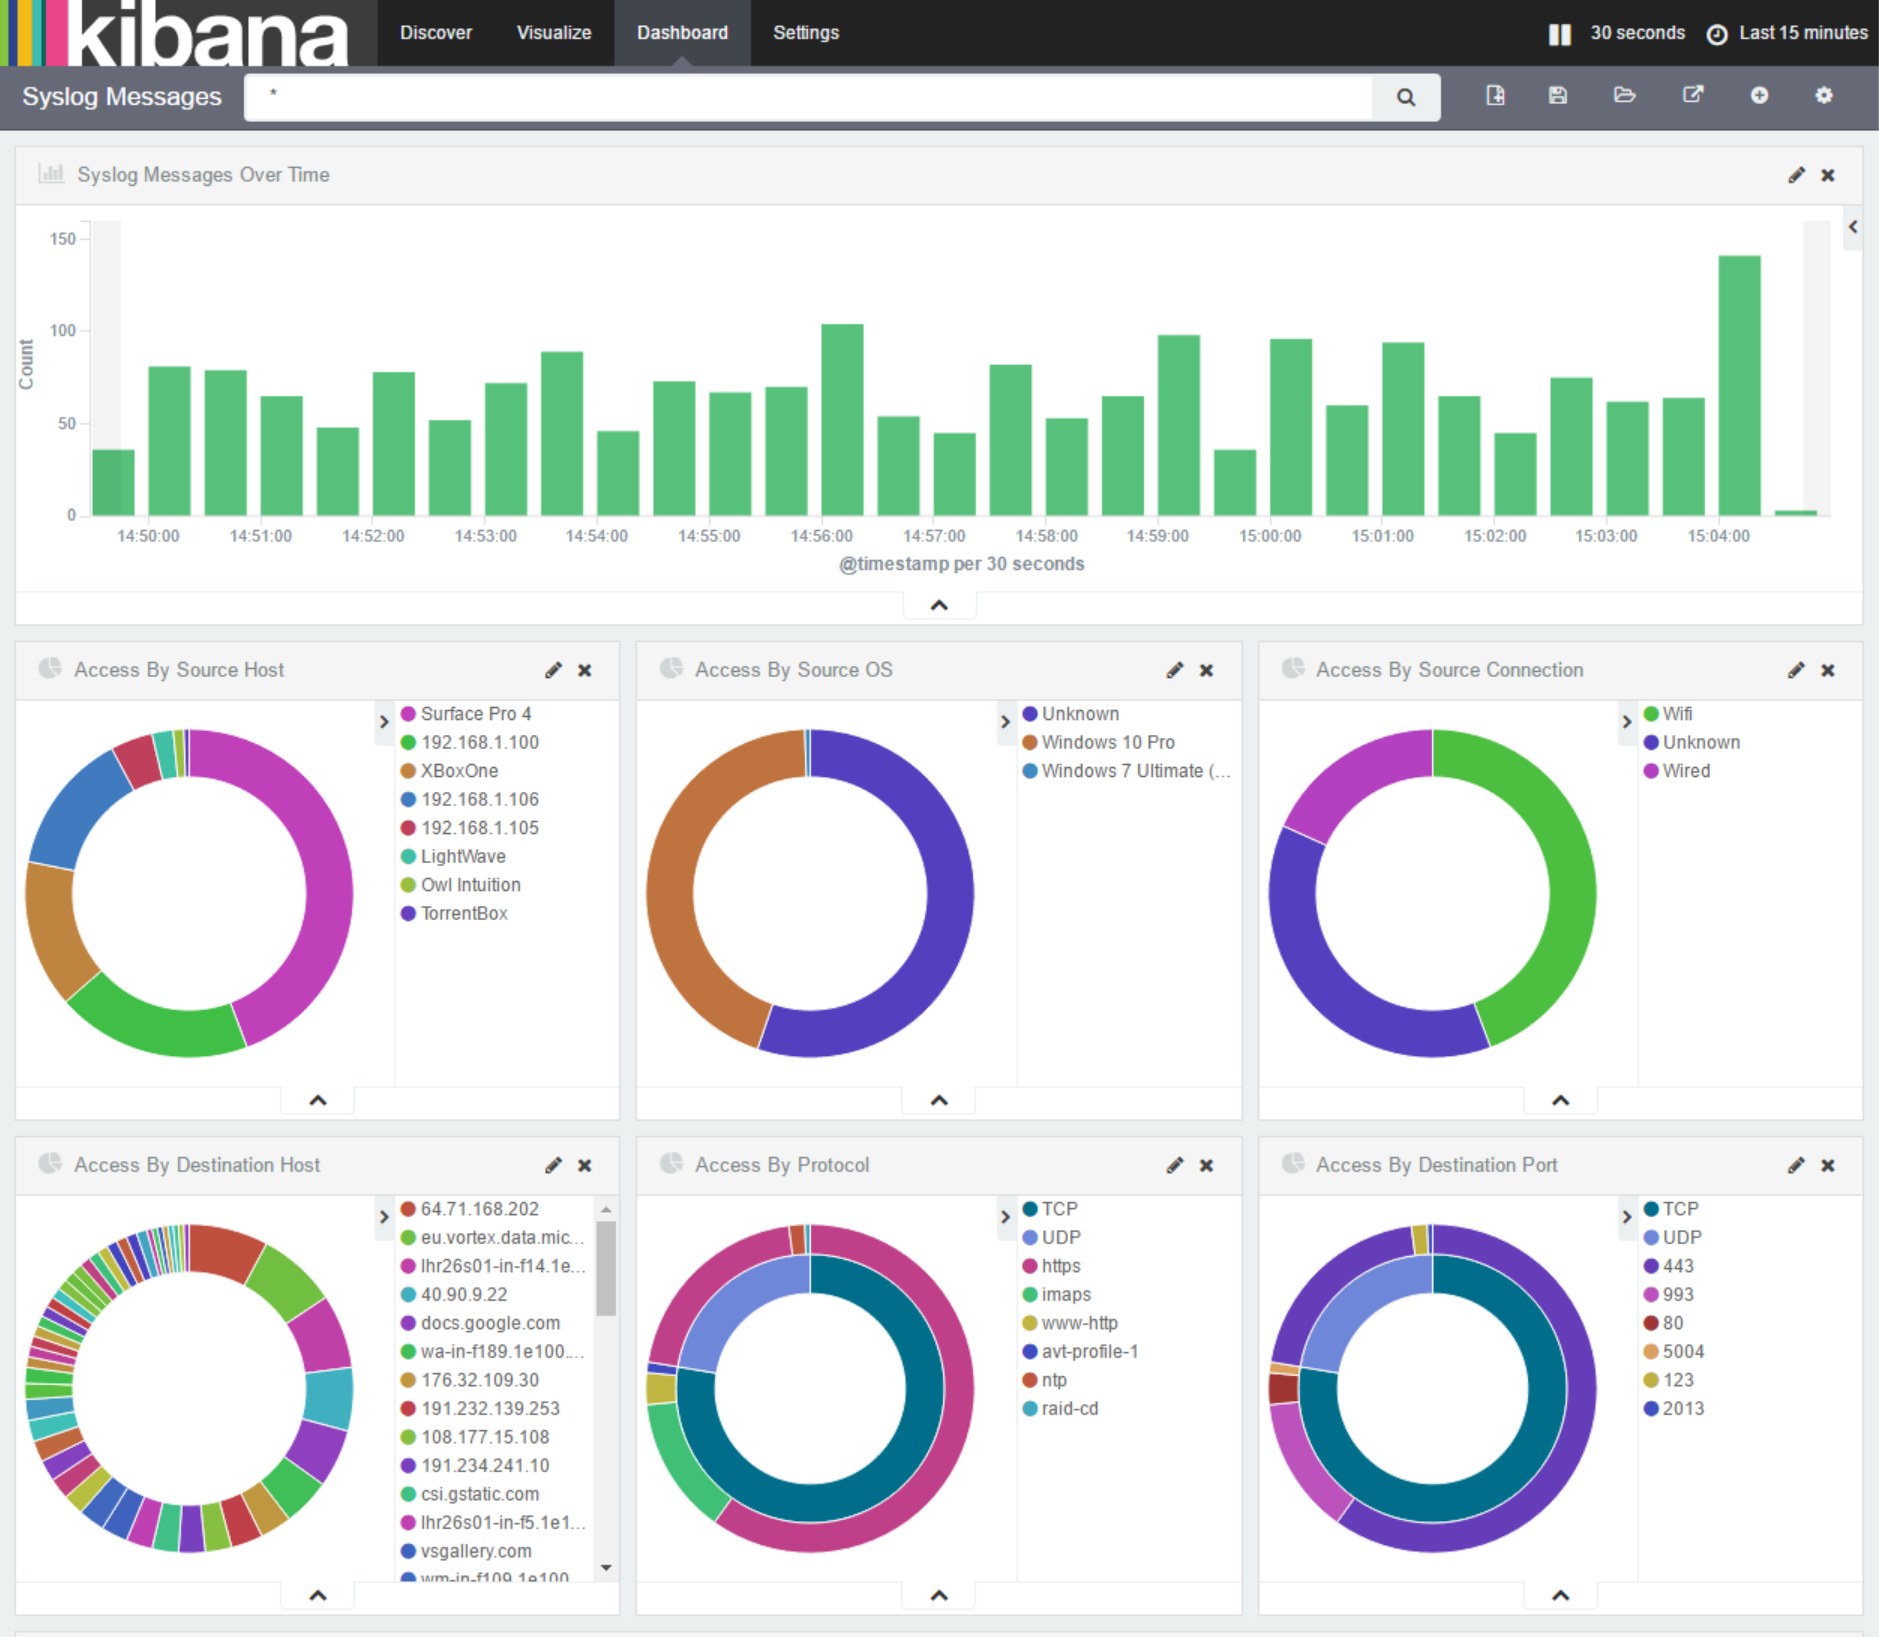
With these in place, the dashboard is starting to come together:
summary
In this post, I showed how to display local device names rather than IP addresses by using LogStash's translate filter. I then used this filter to provide further information about local device and protocols.
In the next post, I'll show how to add some variation to the dashboard by mapping destination locations.