In the last post, I configured Logstash to extracted source and destination address information from the "Client Access Log" Syslog messages sent by my router and added a number of visualizations to my Kibana dashboard which allow me to explore which local devices are access which remote servers.
While this is already very useful, it's almost impossible to remember which devices relate to which IP addresses on the local network, let alone the on the internet. As such, I really want the ability to translate the IP addresses (and, ideally, port numbers) into device, host or protocol names.
translating remote ip addresses to host names
When a local device accesses a remote server it will, ordinarily, do so by resolving an IP address for a host name, for example 'google.com' resolves to the address '216.58.213.110'. On my network, my router acts as a DNS server, resolving names it knows and forwarding unresolved names to Googles DNS servers. A the results of the host name to IP address lookup are cached in the DNS server (e.g. my router) I can perform a reverse DNS lookup at very little processing cost and without consuming any WAN bandwidth.
As usual, Logstash comes with a filter that is able to perform this operation called, unsurprisingly, 'dns'. However, to provide a consistent set of fields to Kibana, it requires a couple of additional steps to ensure it functions consistently. Here is the amended syslog.config with the reverse DNS lookup in place.
input {
  tcp {
    port => 5000
    type => syslog
  }
  udp {
    port => 5000
    type => syslog
  }
}

filter {
    grok {
        match => [ "message", "<%{POSINT:syslog_pri}>%{SYSLOGTIMESTAMP:syslog_timestamp} Vigor\: Local User \(MAC=%{MAC:source_mac}\): %{IP:source_address}(?::%{POSINT:source_port})? -> %{IP:destination_address}(?::%{POSINT:destination_port})? \((?<protocol>TCP|UDP)\)" ]
        add_tag => "access"
    }
    if "access" in [tags] {
        mutate {
            add_field => {
              "destination_host" => "%{[destination_address]}"
            }
        }
        dns {
            reverse => [ "destination_host" ]
            action => "replace"
            nameserver => "192.168.1.1"
        }
    }
}

output {
  elasticsearch {
    hosts => ["192.168.1.30:9200"]
    index => "syslog-%{+YYYY.MM.dd}"
  }
}
Note that, when an 'access' message is successfully grokked, I add a tag to the tags array field of the message called "access". If another type of message has been received (i.e. a DNS lookup) then the grok pattern won't match and the 'access' tag will not be added to tags.
After the grok filter, I check to see if the tags field contains the 'access' tag and, if so, use the mutate filter to copy the 'destination_address' field value into a 'destination_host' field. This is done as the dns filter will replace the field value if a successful reverse DNS lookup is performed but will leave the original value (i.e. the IP address) if a reverse DNS could not be performed. This way we either get the host name or IP address in the 'destination_host' field and it's never empty.
With the changes to configuration in place, I restart Logstash. Then, in Kibana, I refresh the field list for the 'syslog-*' index, add 'destination_host' to the 'Syslog Messages' saved search, load 'Access By Destination Address' visualization and modify it to use 'destination_host' rather than the 'destination_address' field; and get the following:
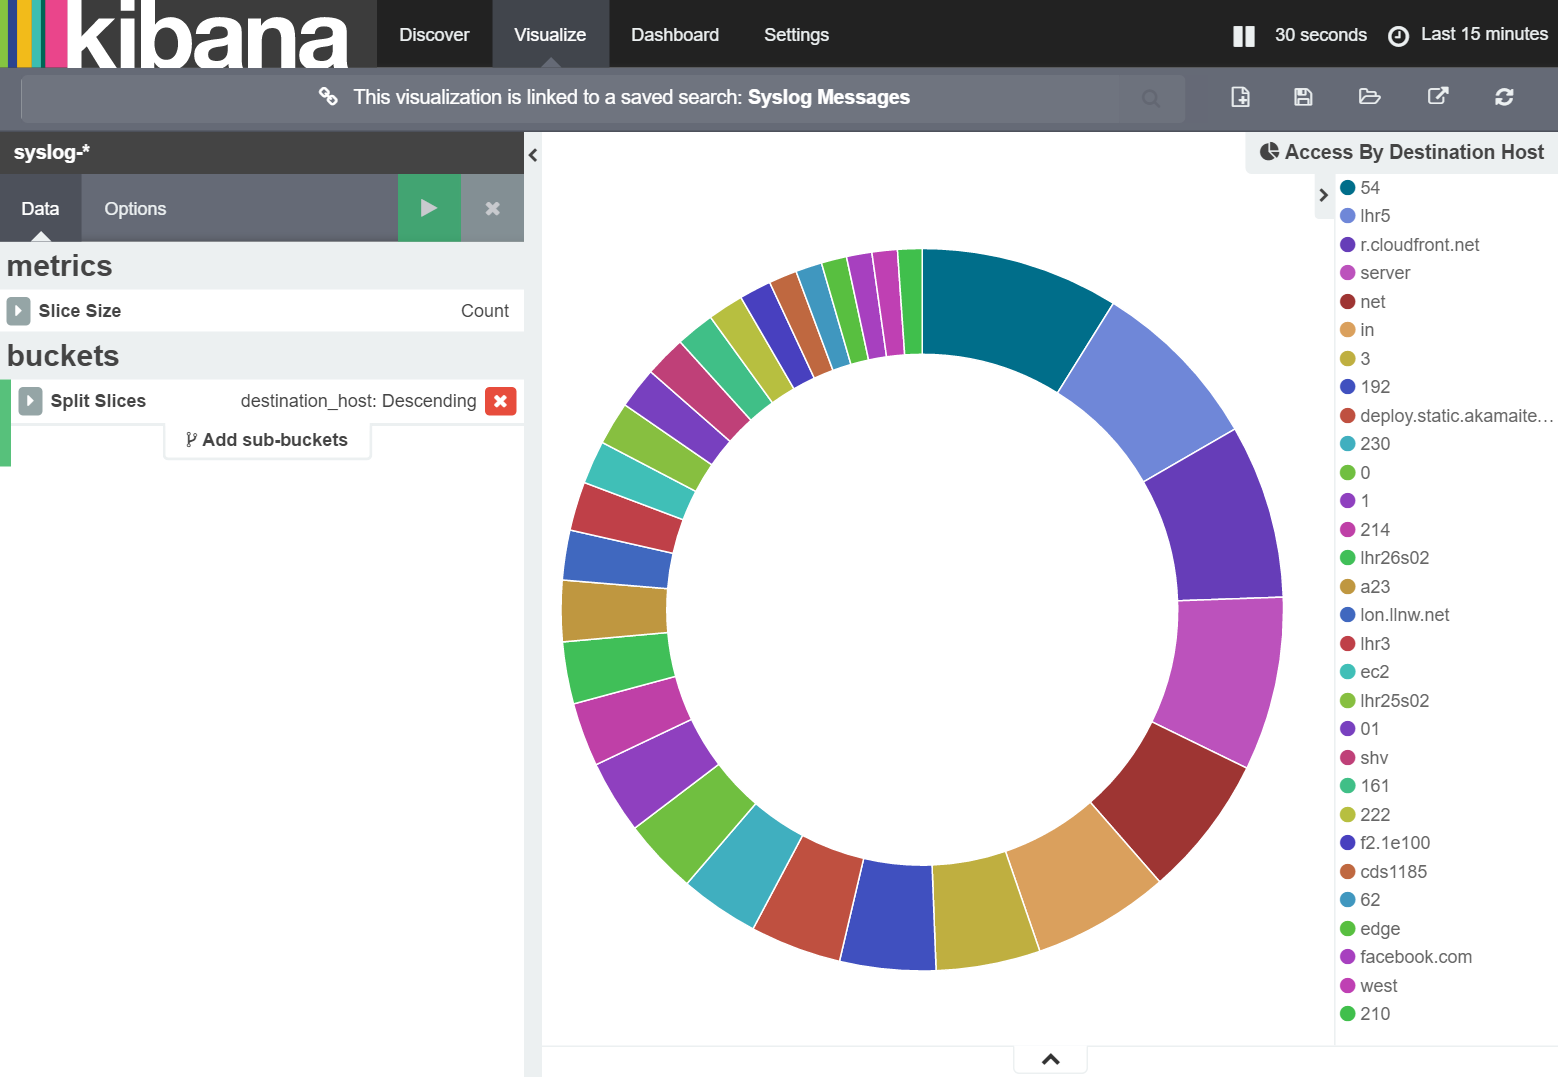
While initially it looks promising, a quick look at the list of hosts being accessed shows something peculiar: the domain names have been split into their component parts.
analysis, mappings and templates
The reason for the host names being split is because, by default, ElasticSearch performs 'analysis' on text strings. This analysis involves splitting the strings into discrete words which can be indexed more efficiently. Some strings however, for example domain names, should be treated as a single word and as such we need to prevent ElasticSearch from performing the analysis.
How ElasticSearch treats various fields within a message can be controlled by modifying the index mapping. The current mapping for the 'syslog' index can be retrieved by a REST call to the address 'http://[ElasticSearchHost]:9200/syslog-2016.04.12/_mapping'. This returns:
{
    "syslog-2016.04.12": {
        "mappings": {
            "syslog": {
                "properties": {
                    "@@timestamp": {
                        "type": "date",
                        "format": "strict_date_optional_time||epoch_millis"
                    },
                    "@@version": {
                        "type": "string"
                    },
                    "destination_address": {
                        "type": "string"
                    },
                    "destination_host": {
                        "type": "string"
                    },
                    "destination_port": {
                        "type": "string"
                    },
                    "host": {
                        "type": "string"
                    },
                    "message": {
                        "type": "string"
                    },
                    "protocol": {
                        "type": "string"
                    },
                    "source_address": {
                        "type": "string"
                    },
                    "source_mac": {
                        "type": "string"
                    },
                    "source_port": {
                        "type": "string"
                    },
                    "syslog_pri": {
                        "type": "string"
                    },
                    "syslog_timestamp": {
                        "type": "string"
                    },
                    "tags": {
                        "type": "string"
                    },
                    "type": {
                        "type": "string"
                    }
                }
            }
        }
    }
}
In order to prevent ElasticSearch from analysing the 'destination_host' field, we need to add an 'index' key with the value 'not_analyzed'. Even though things have been mostly working correctly so far, I can save quite a bit of storage and processing time by marking almost all of the string fields as 'not_analyzed'. This is shown below:
{
    "syslog-2016.04.12": {
        "mappings": {
            "syslog": {
                "properties": {
                    "@@timestamp": {
                        "type": "date",
                        "format": "strict_date_optional_time||epoch_millis"
                    },
                    "@@version": {
                        "type": "string"
                    },
                    "destination_address": {
                        "type": "string",
                        "index" : "not_analyzed"
                    },
                    "destination_host": {
                        "type": "string",
                        "index" : "not_analyzed"
                    },
                    "destination_port": {
                        "type": "integer"
                    },
                    "host": {
                        "type": "string",
                        "index" : "not_analyzed"
                    },
                    "message": {
                        "type": "string"
                    },
                    "protocol": {
                        "type": "string",
                        "index" : "not_analyzed"
                    },
                    "source_address": {
                        "type": "string",
                        "index" : "not_analyzed"
                    },
                    "source_mac": {
                        "type": "string",
                        "index" : "not_analyzed"
                    },
                    "source_port": {
                        "type": "integer"
                    },
                    "syslog_pri": {
                        "type": "integer"
                    },
                    "syslog_timestamp": {
                        "type": "string"
                    },
                    "tags": {
                        "type": "string"
                    },
                    "type": {
                        "type": "string"
                    }
                }
            }
        }
    }
}
Now, while I could write this mapping directly to the ElasticSearch index, as the index is date-based, I'd have to resend the mapping manually everyday. Instead, I am going to create a mapping template that will match an index name based on pattern and automatically apply the template. This is done by crafting a PUT call to the ElasticSearch '_template' endpoint with the specific template name. In short, the following mapping template is posted to http://[ElasticSearch:9200]/_templates/syslog_template
{
        "template": "syslog-*",
        "mappings": {
            "syslog": {
                "properties": {
                    "@@timestamp": {
                        "type": "date",
                        "format": "strict_date_optional_time||epoch_millis"
                    },
                    "@@version": {
                        "type": "string"
                    },
                    "destination_address": {
                        "type": "string",
                        "index" : "not_analyzed"
                    },
                    "destination_host": {
                        "type": "string",
                        "index" : "not_analyzed"
                    },
                    "destination_port": {
                        "type": "integer"
                    },
                    "host": {
                        "type": "string",
                        "index" : "not_analyzed"
                    },
                    "message": {
                        "type": "string"
                    },
                    "protocol": {
                        "type": "string",
                        "index" : "not_analyzed"
                    },
                    "source_address": {
                        "type": "string",
                        "index" : "not_analyzed"
                    },
                    "source_mac": {
                        "type": "string",
                        "index" : "not_analyzed"
                    },
                    "source_port": {
                        "type": "integer"
                    },
                    "syslog_pri": {
                        "type": "integer"
                    },
                    "syslog_timestamp": {
                        "type": "string"
                    },
                    "tags": {
                        "type": "string"
                    },
                    "type": {
                        "type": "string"
                    }
                }
            }
        }
}
With this in place I need to delete todays syslog index so that it is recreated, using the mapping above, when the first syslog message is received. Once this has been done, the visualization looks like this:
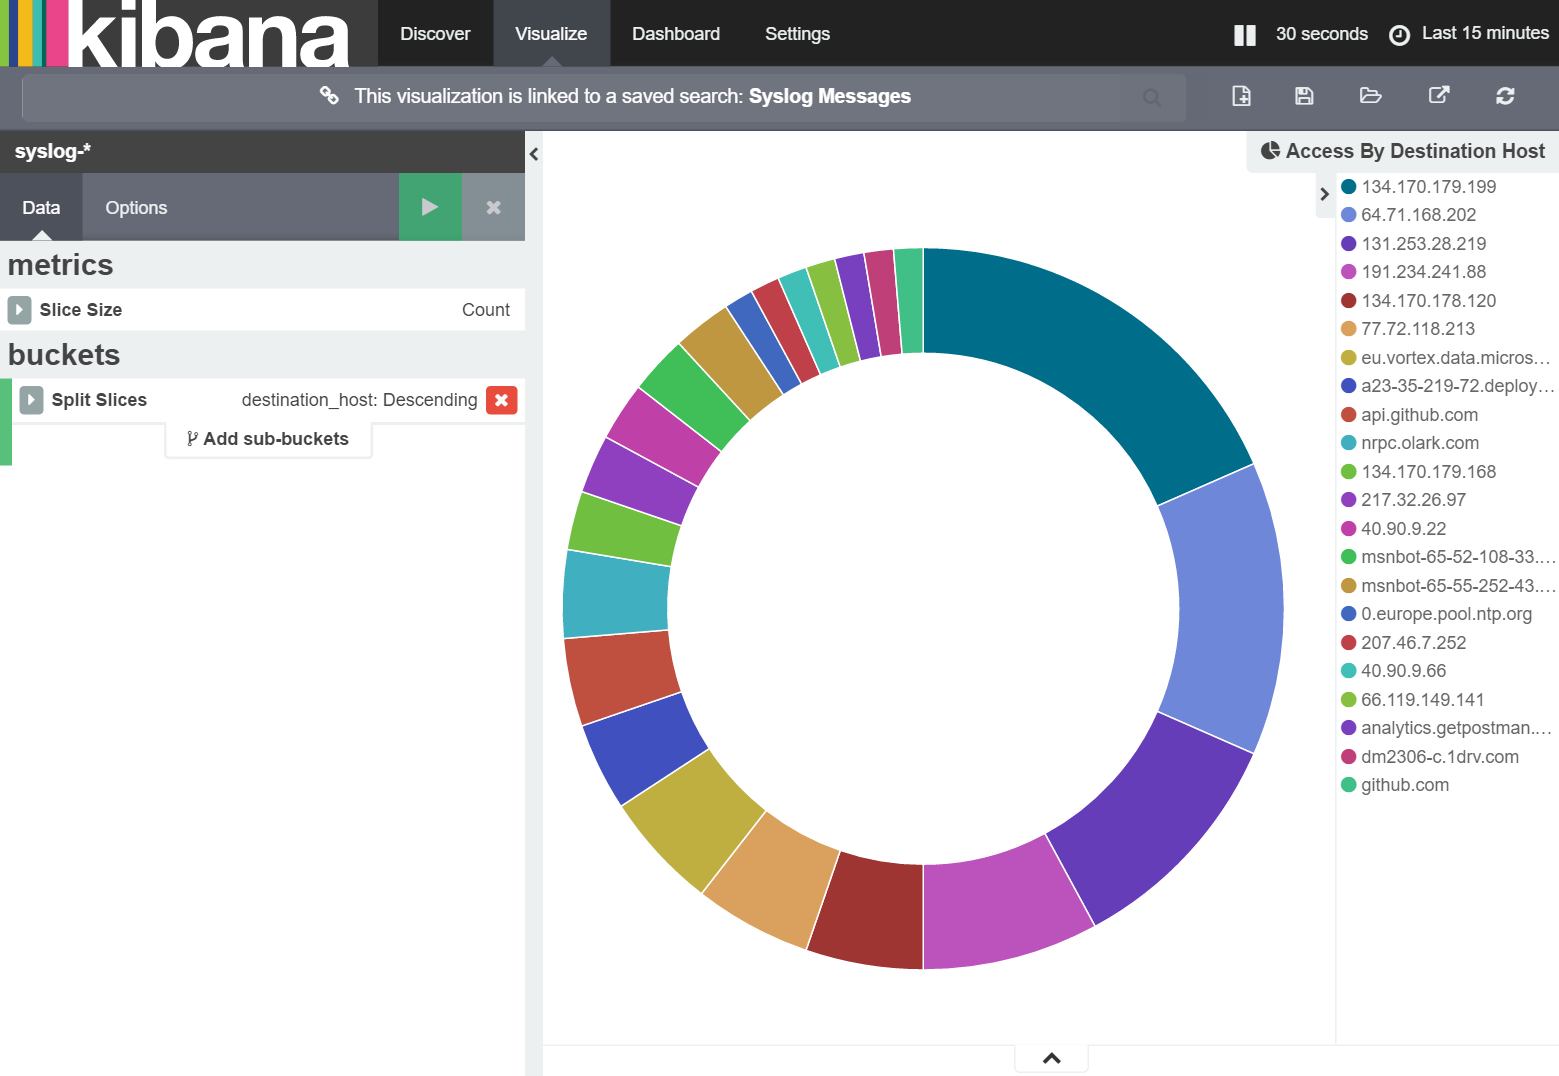
Nice!
summary
In this post, I showed how to display host names for accessed servers rather than IP addresses. I also covered how to update ElasticSearch mapping such that field 'analysis' can be prevented and host names kept together.
In the next post, I'll show how to translate local device IP addresses in to device names.