In part one of this series I set up my home router to send a variety of Syslog messages to LogStash which then forwarded these messages to ElasticSearch for indexing and querying by Kibana in a simplistic dashboard. In this post, I'm going to start parsing out some of the details of the Syslog messages to start giving us a clearer idea about which devices on my local network are opening sessions with remote servers.
message types
My router sends a number of different messages types; everything from router/dsl bandwidth information to the firewall log as can be seen below:
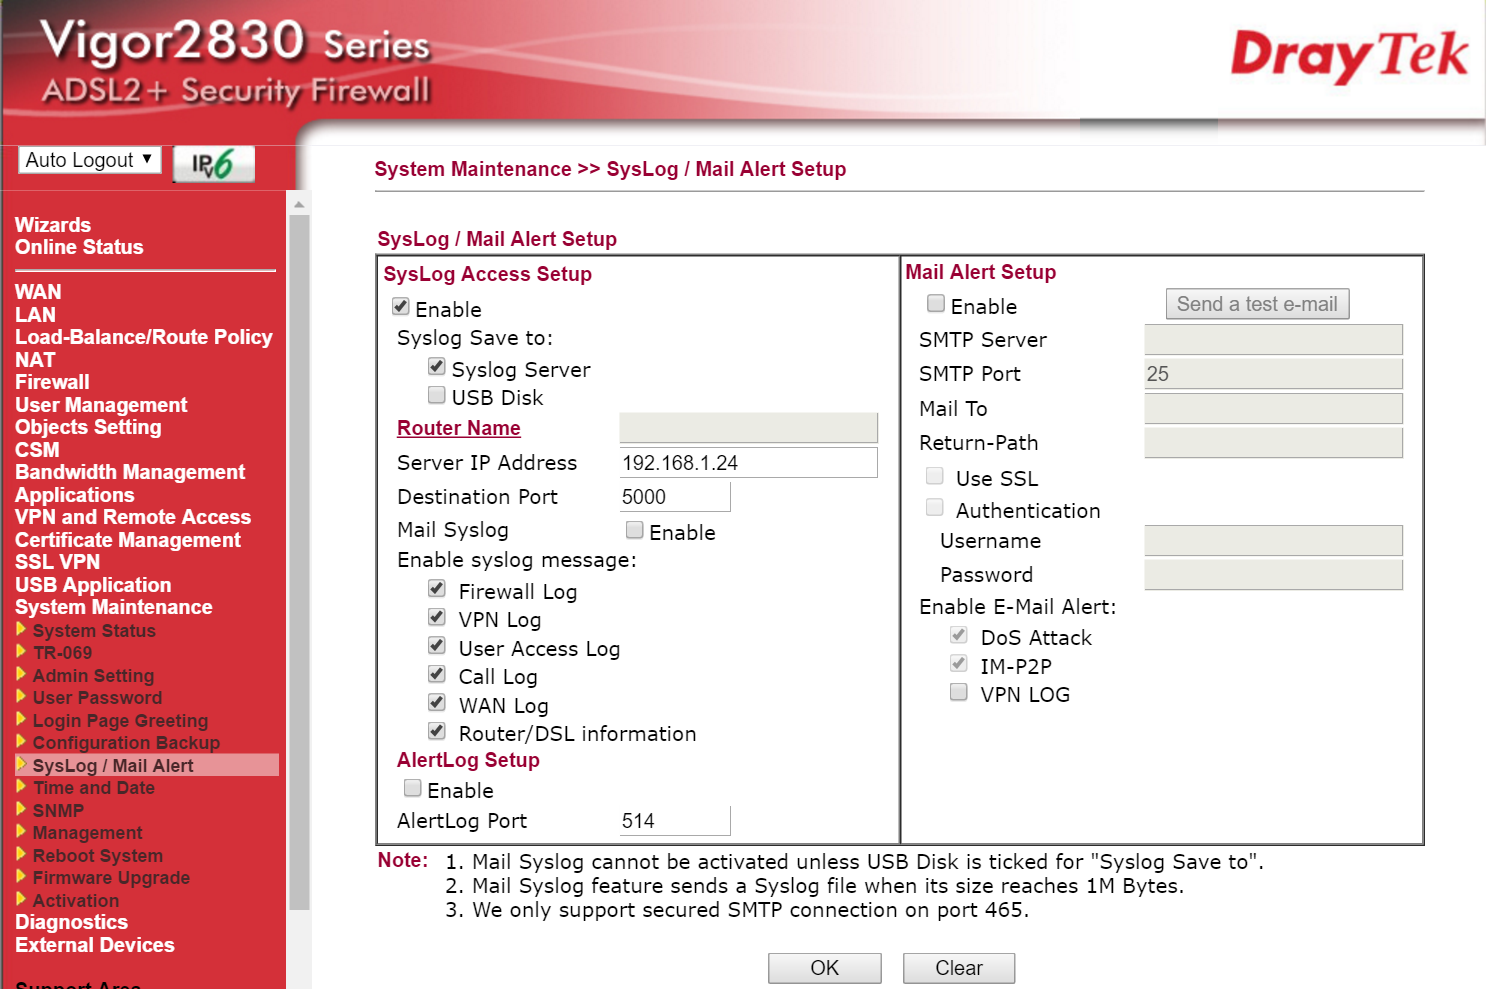
For now, I'm really only interested in the 'User Access Log' which tells us when a local device resolves an IP address for a domain name or accesses a remote server. This log constitutes a number of message types such as:
TCP / UDP access This message is sent by the router when a device on the local network accesses a remote server via TCP or UDP. It looks like this:
<150>Apr 10 16:55:38 Vigor: Local User (MAC=00-00-00-00-00-00): 192.168.1.205:64281 -> 5.10.110.36:80 (TCP)Web. From this type of message I am interested in parsing out:- Syslog timestamp
- Syslog username
- Source Mac Address
- Source IP Address
- Destination IP Address
- Protocol
DNS lookup This message is sent by the router when a device on the local network resolves an IP address for a remote server DNS nane. It looks like this:
<150>Apr 10 18:52:49 Vigor: Local User (MAC=00-00-00-00-00-00): 192.168.1.62 DNS -> 192.168.1.1 inquire a.root-servers.net. From this type of message I am interested in parsing out:- Syslog timestamp
- Syslog username
- Source Mac Address
- Source IP Address
- Domain being resolved
In this post I'll focus on enriching the incoming message with information from the access message but will move on to parsing multiple message types in a future post.
parsing access messages
Logstash provides a great tool for parsing messages: the 'grok' filter. As explained in the documentation 'grok' allows you to 'Parse arbitrary text and structure it. This tool is perfect for syslog logs, apache and other webserver logs, mysql logs, and in general, any log format that is generally written for humans and not computer consumption.'
This filter applies a regular expression like patterns to a field in the incoming message and, if matched successfully, adds each matched expression to the message being processed as a new field. The fields to capture are defined in the format %{SYNTAX:SEMANTIC} where the SYNTAX element is a known pattern (see below) or a regular expression and the SEMANTIC is a name of the field to capture.
Logstash ships with over 120 known SYNTAX patterns and these patterns can be supplemented by adding new pattern files to a specific directory. However, the default patterns supplied cover nearly all common scenarios and allow almost all the pertinent information in the TCP access message above to be parsed.
So, by just using the default patterns, I can write the expression
<%{POSINT:syslog_pri}>%{SYSLOGTIMESTAMP:syslog_timestamp} Vigor\: Local User \(MAC=%{MAC:source_mac}\): %{IP:source_address}(?::%{POSINT:source_port})? -> %{IP:destination_address}(?::%{POSINT:destination_port})?
Which gives us the following additional fields in the message:
| field | value |
|---|---|
| source_address | 192.168.1.205 |
| source_port | 64281 |
| source_mac | 00-00-00-00-00-00 |
| syslog_pri | 150 |
| syslog_timestamp | Apr·10·16:55:38 |
| destination_address | 5.10.110.36 |
| destination_port | 80 |
Neat huh! I'd also like to know whether the access message is TCP or UDP so I'm going to add a custom regular expression to the end of the pattern to parse the protocol string out of the message. In full the pattern is now:
<%{POSINT:syslog_pri}>%{SYSLOGTIMESTAMP:syslog_timestamp} Vigor\: Local User \(MAC=%{MAC:source_mac}\): %{IP:source_address}(?::%{POSINT:source_port})? -> %{IP:destination_address}(?::%{POSINT:destination_port})? \((?<protocol>TCP|UDP)\)
This would result in the following fields available in the message:
| field | value |
|---|---|
| source_address | 192.168.1.205 |
| source_port | 64281 |
| source_mac | 00-00-00-00-00-00 |
| syslog_pri | 150 |
| syslog_timestamp | Apr·10·16:55:38 |
| destination_address | 5.10.110.36 |
| destination_port | 80 |
| protocol | TCP |
NOTE: You can use Grok Constructor to help you perfect your grok expressions prior to trying them in Logstash
adding the grok filter to logstash
So, now I know how to extract all the information I'm interested in from the access message, I need to get Logstash to actually do it. This is done by adding a grok filter to the filter { } section of the syslog.config file authored in the previous post as shown here:
input {
  tcp {
    port => 5000
    type => syslog
  }
  udp {
    port => 5000
    type => syslog
  }
}

filter {
    grok {
      match => [ "message", "<%{POSINT:syslog_pri}>%{SYSLOGTIMESTAMP:syslog_timestamp} Vigor\: Local User \(MAC=%{MAC:source_mac}\): %{IP:source_address}(?::%{POSINT:source_port})? -> %{IP:destination_address}(?::%{POSINT:destination_port})? \((?<protocol>TCP|UDP)\)" ]
    }
}

output {
  elasticsearch {
    hosts => ["192.168.1.30:9200"]
    index => "syslog-%{+YYYY.MM.dd}"
  }
}
Notice the grok section in which we specify a 'match' field. This field takes an array of two strings; the first string is the field containing the text to match and the second is the pattern to match the text to.
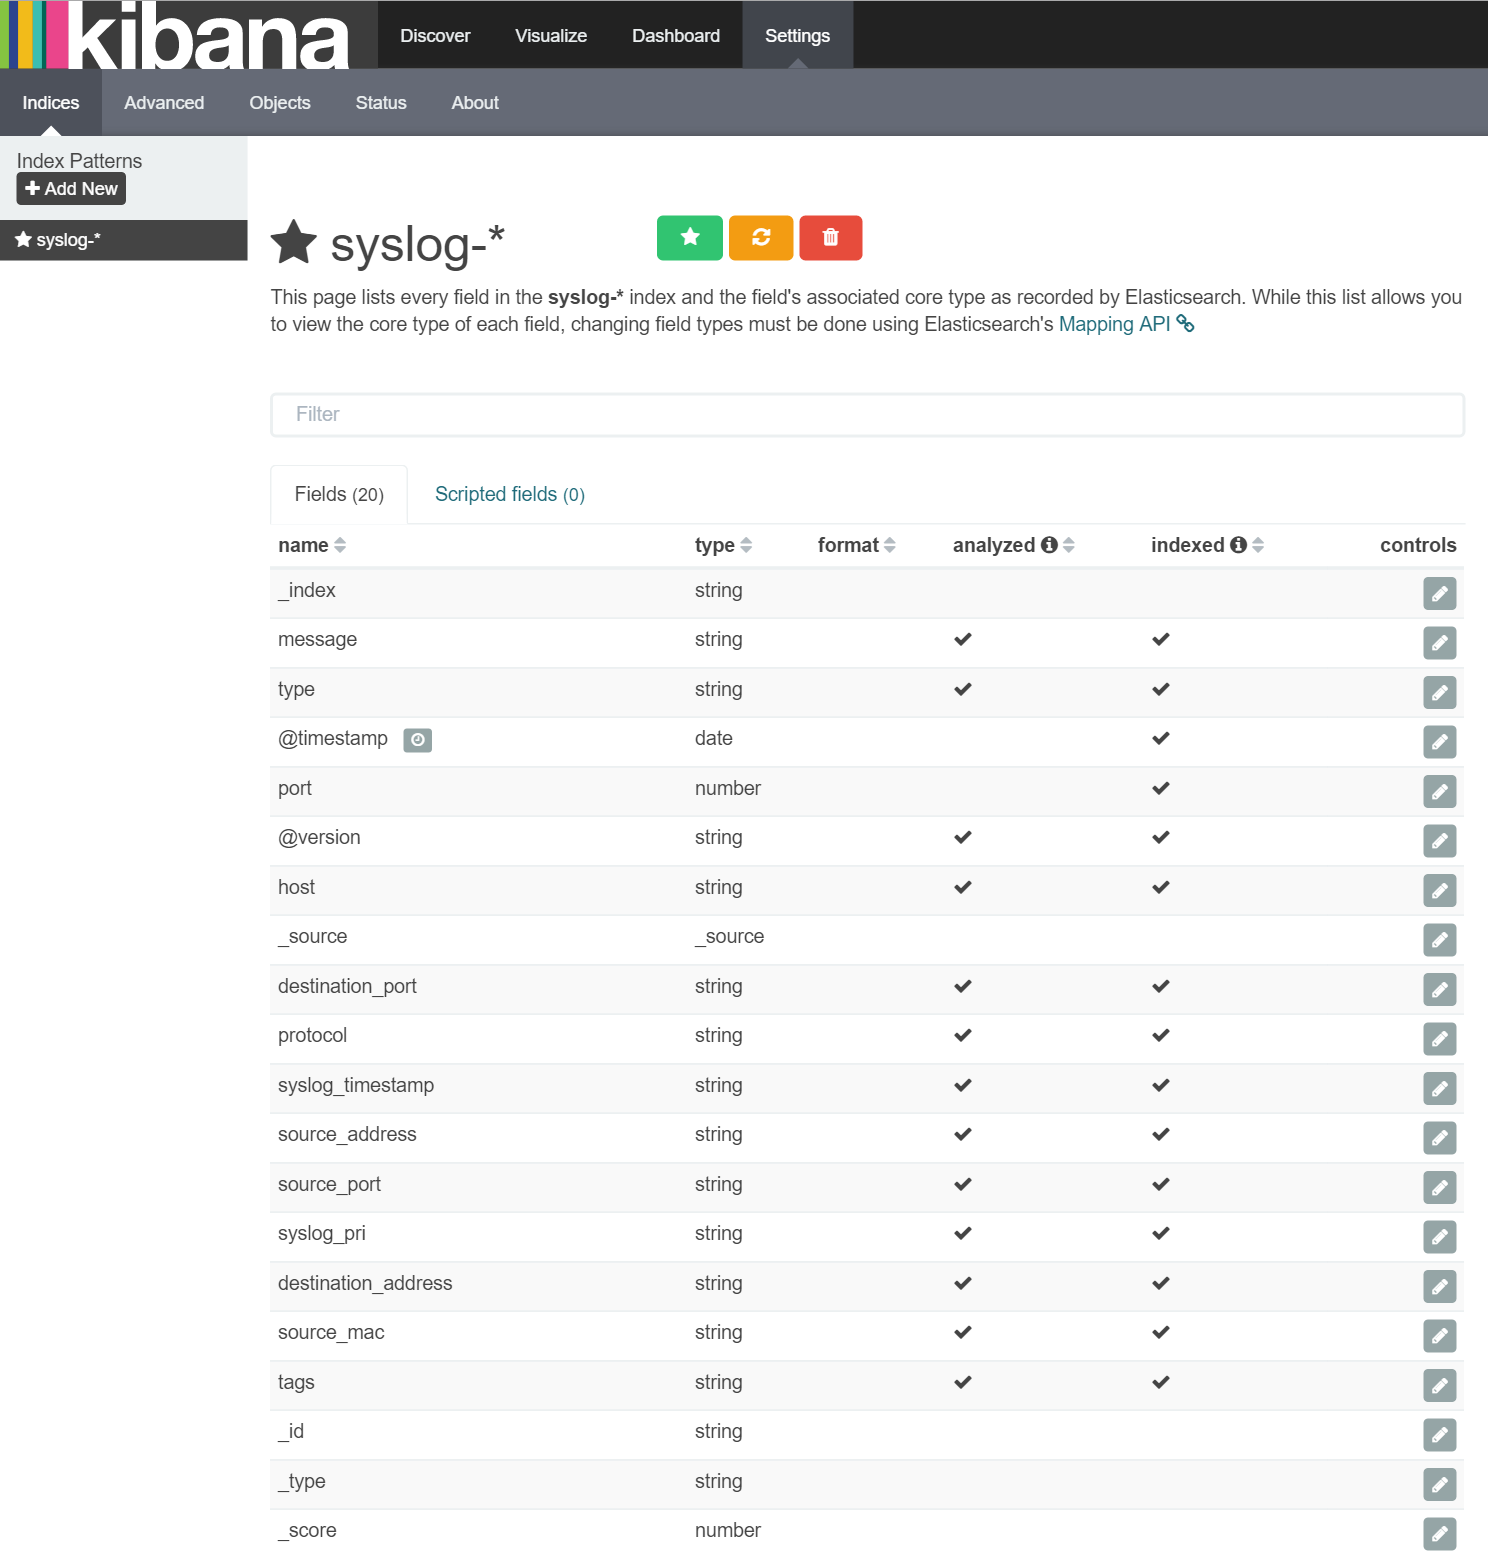
Once this is added to the syslog.config file and Logstash restarted, these new fields should be being written to ElasticSearch. The easiest way to see if this is working is to return to Kibana and, from the 'Settings/Indices' area, click the 'syslog-*' pattern on the left and then click the orange 'Refresh field list' button and the field list appears like this:
exploring network access information
Now the additional fields are available to Kibana, I can start exploring the data to learn about which devices on my network are access which remote servers.
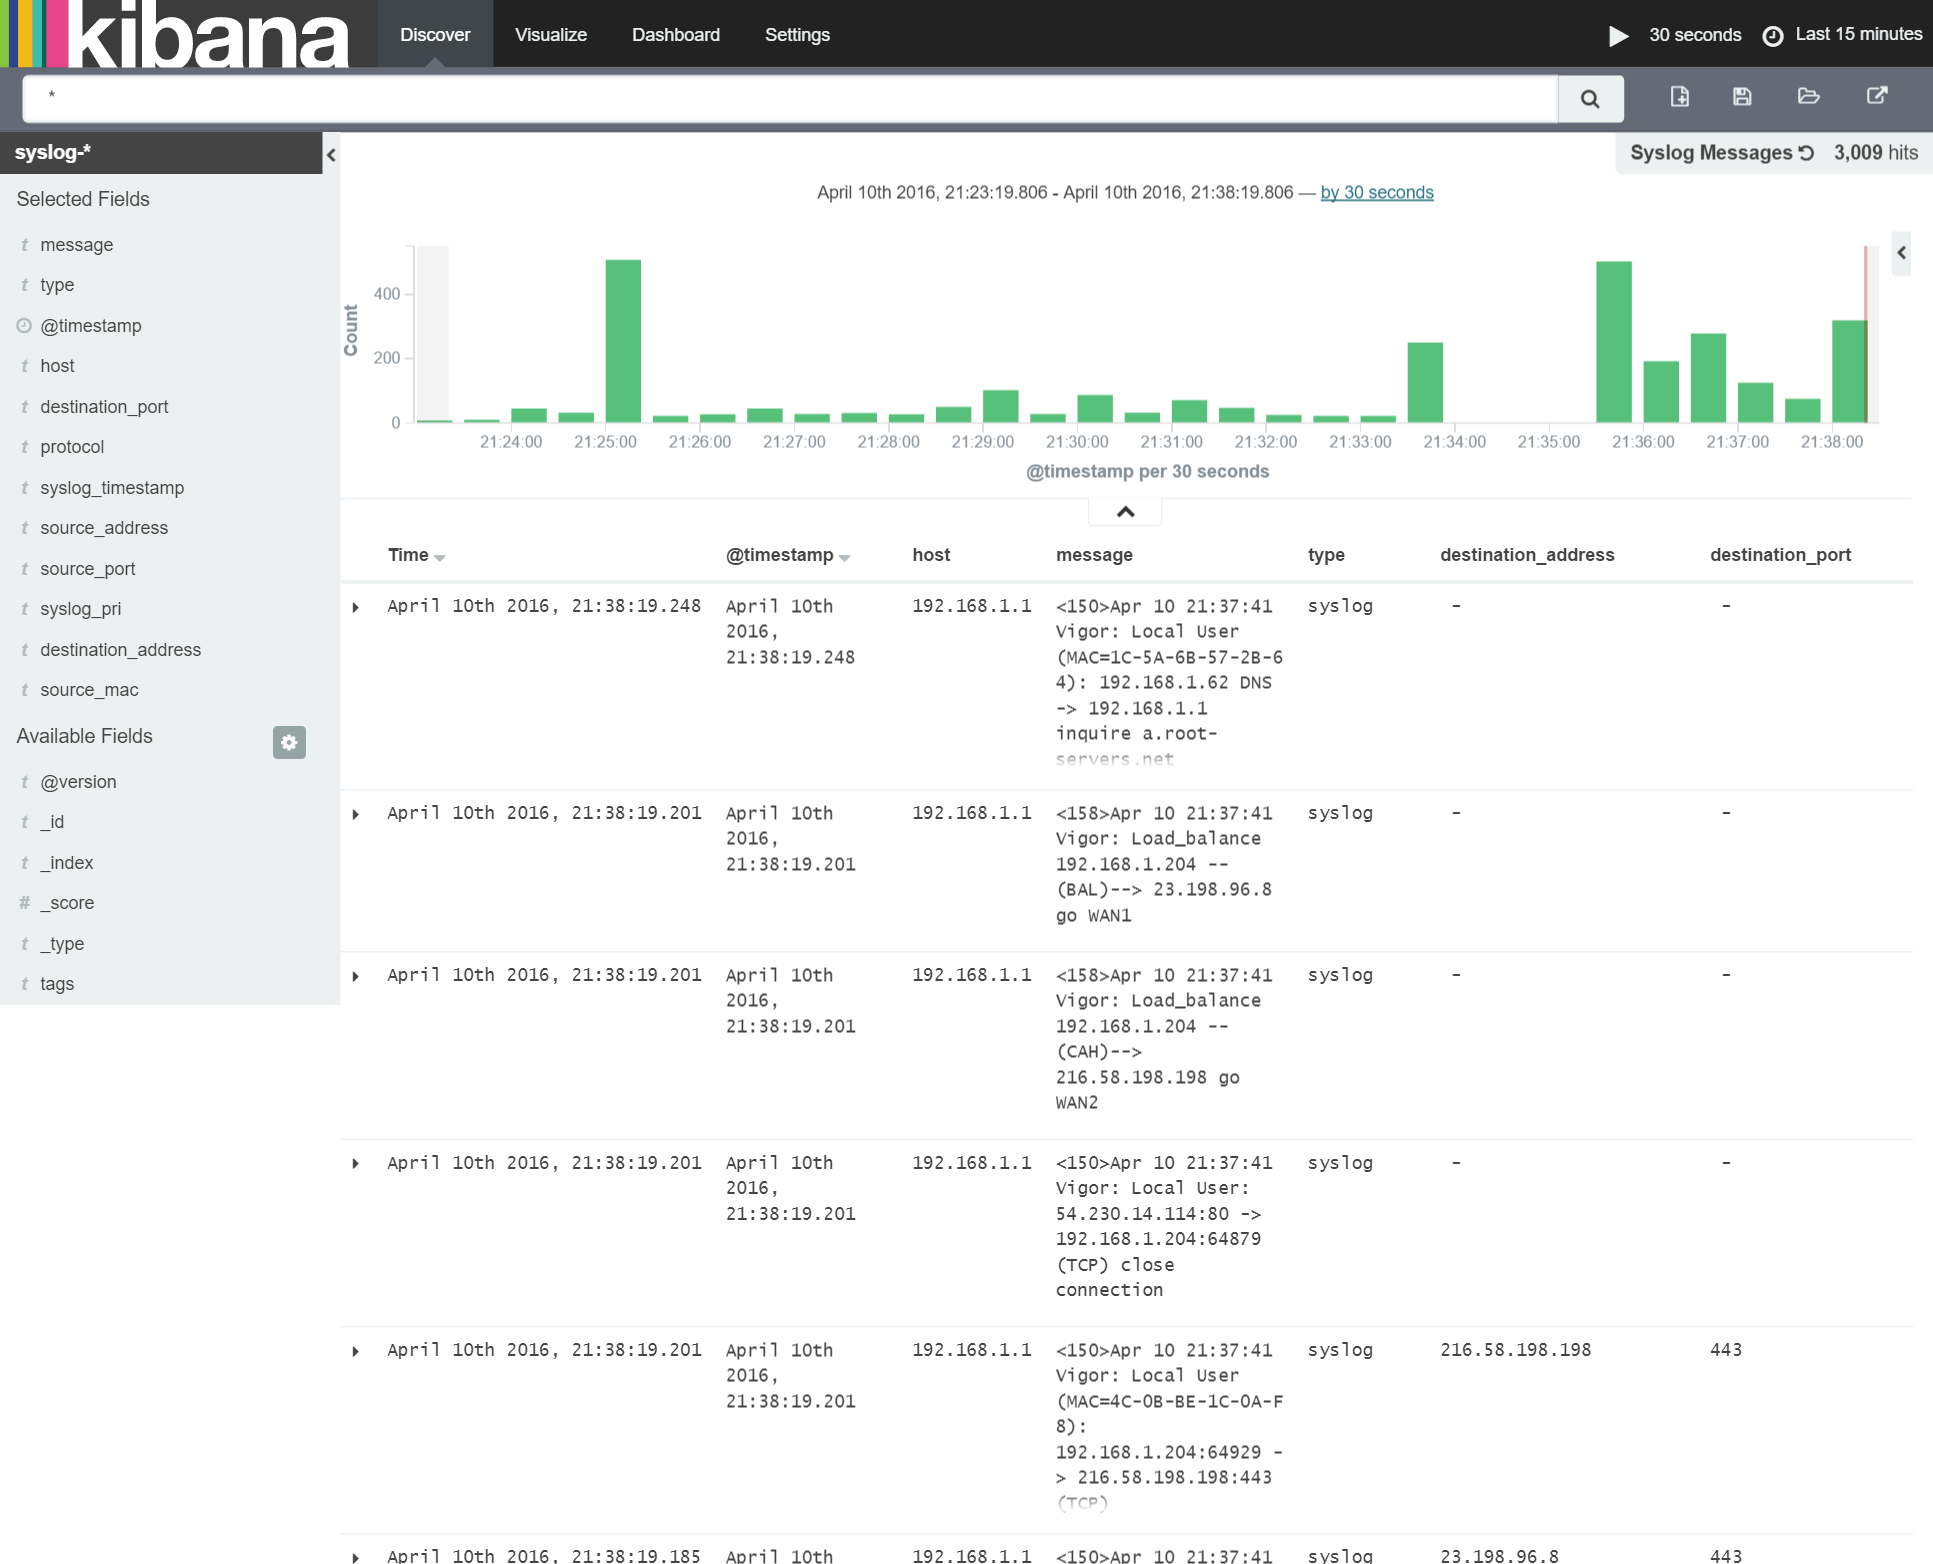
To do this I first need to add the new fields to the 'Syslog Messages' saved search. This can be done by navigating to the 'Discover' page, loading the 'Syslog Messages' search (using the 'Load Saved Search' button in the top right of the screen), adding the new fields and re-saving it. This is shown below:
I'm now able to add some very interesting new visualizations to our dashboard such as:
- Number of access by each local device
- Number of access by port
- Number of access to each remote server
- Number of access by protocol
I'll only run through adding the first visualization is they're all very similar.
First, I navigate to the 'Visualization' area and click the 'New Visualization' button. I want to see the number of accesses being made by each device as a fraction of the whole so will use a donut chart. This is done by selecting 'Pie chart' from the "Create new Visualization" menu and selecting our 'Syslog Messages' saved search in the "Select a search source" menu. Once this is done, I get a pie chart with a single section as shown here:
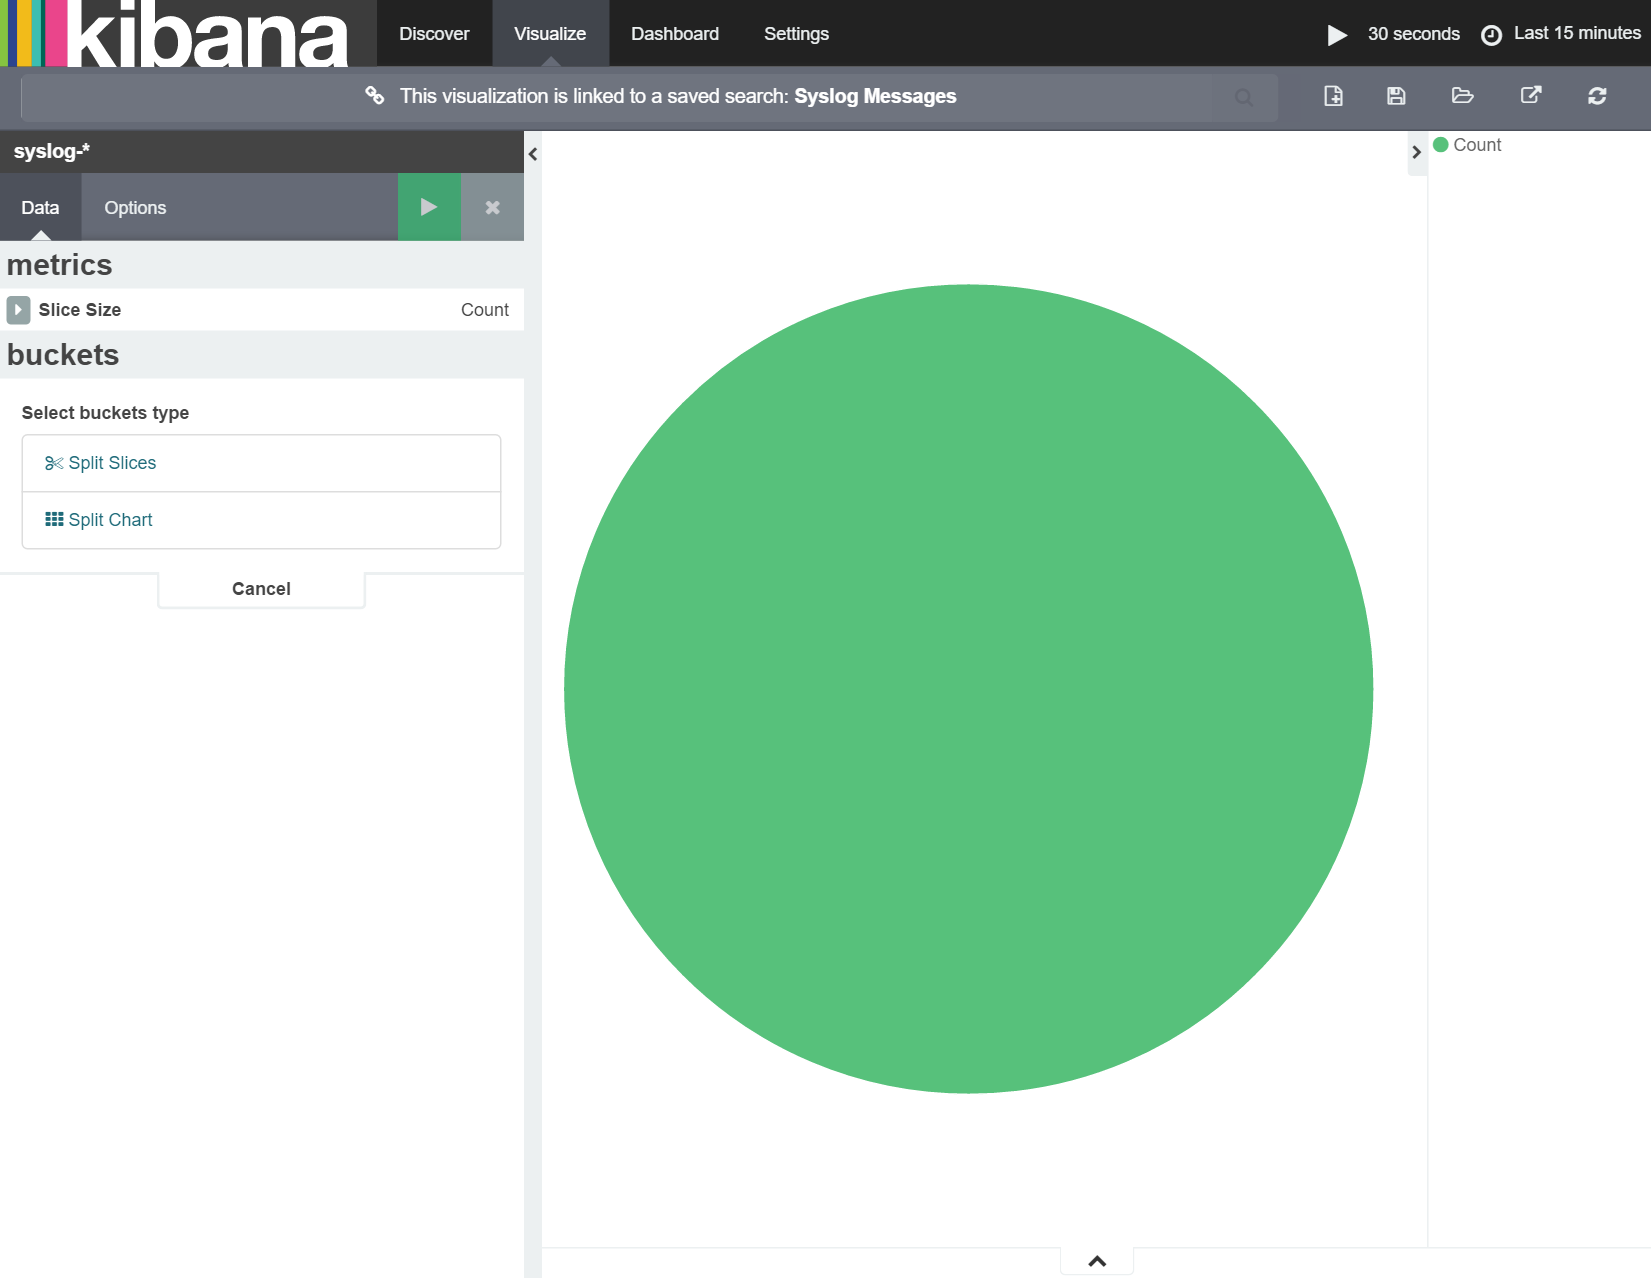
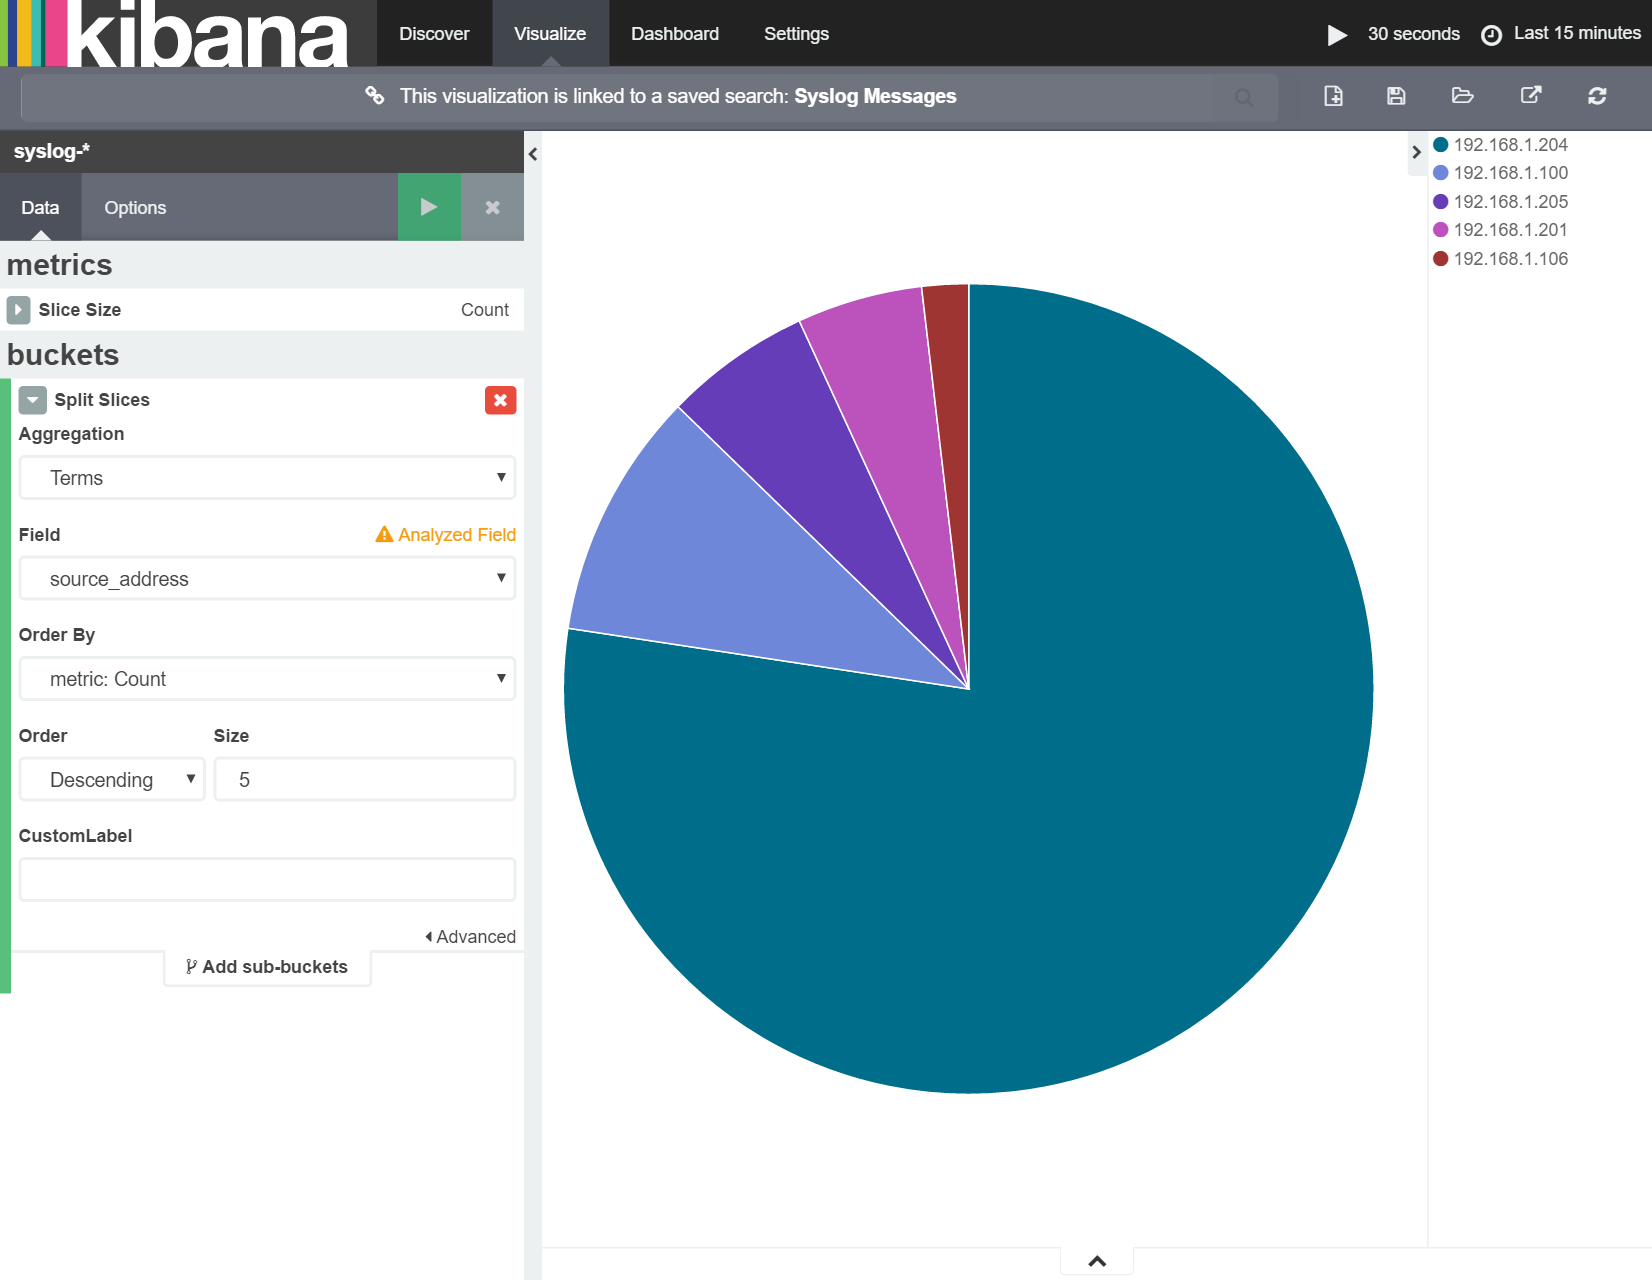
I then need to select the 'Split Slices' bucket type, choose 'Terms' as the aggregation type and finally select 'source_address' as the field on which to aggregate (i.e. count) unique terms. Applying this to the pie-chart (using the 'Apply' button) results in the following:
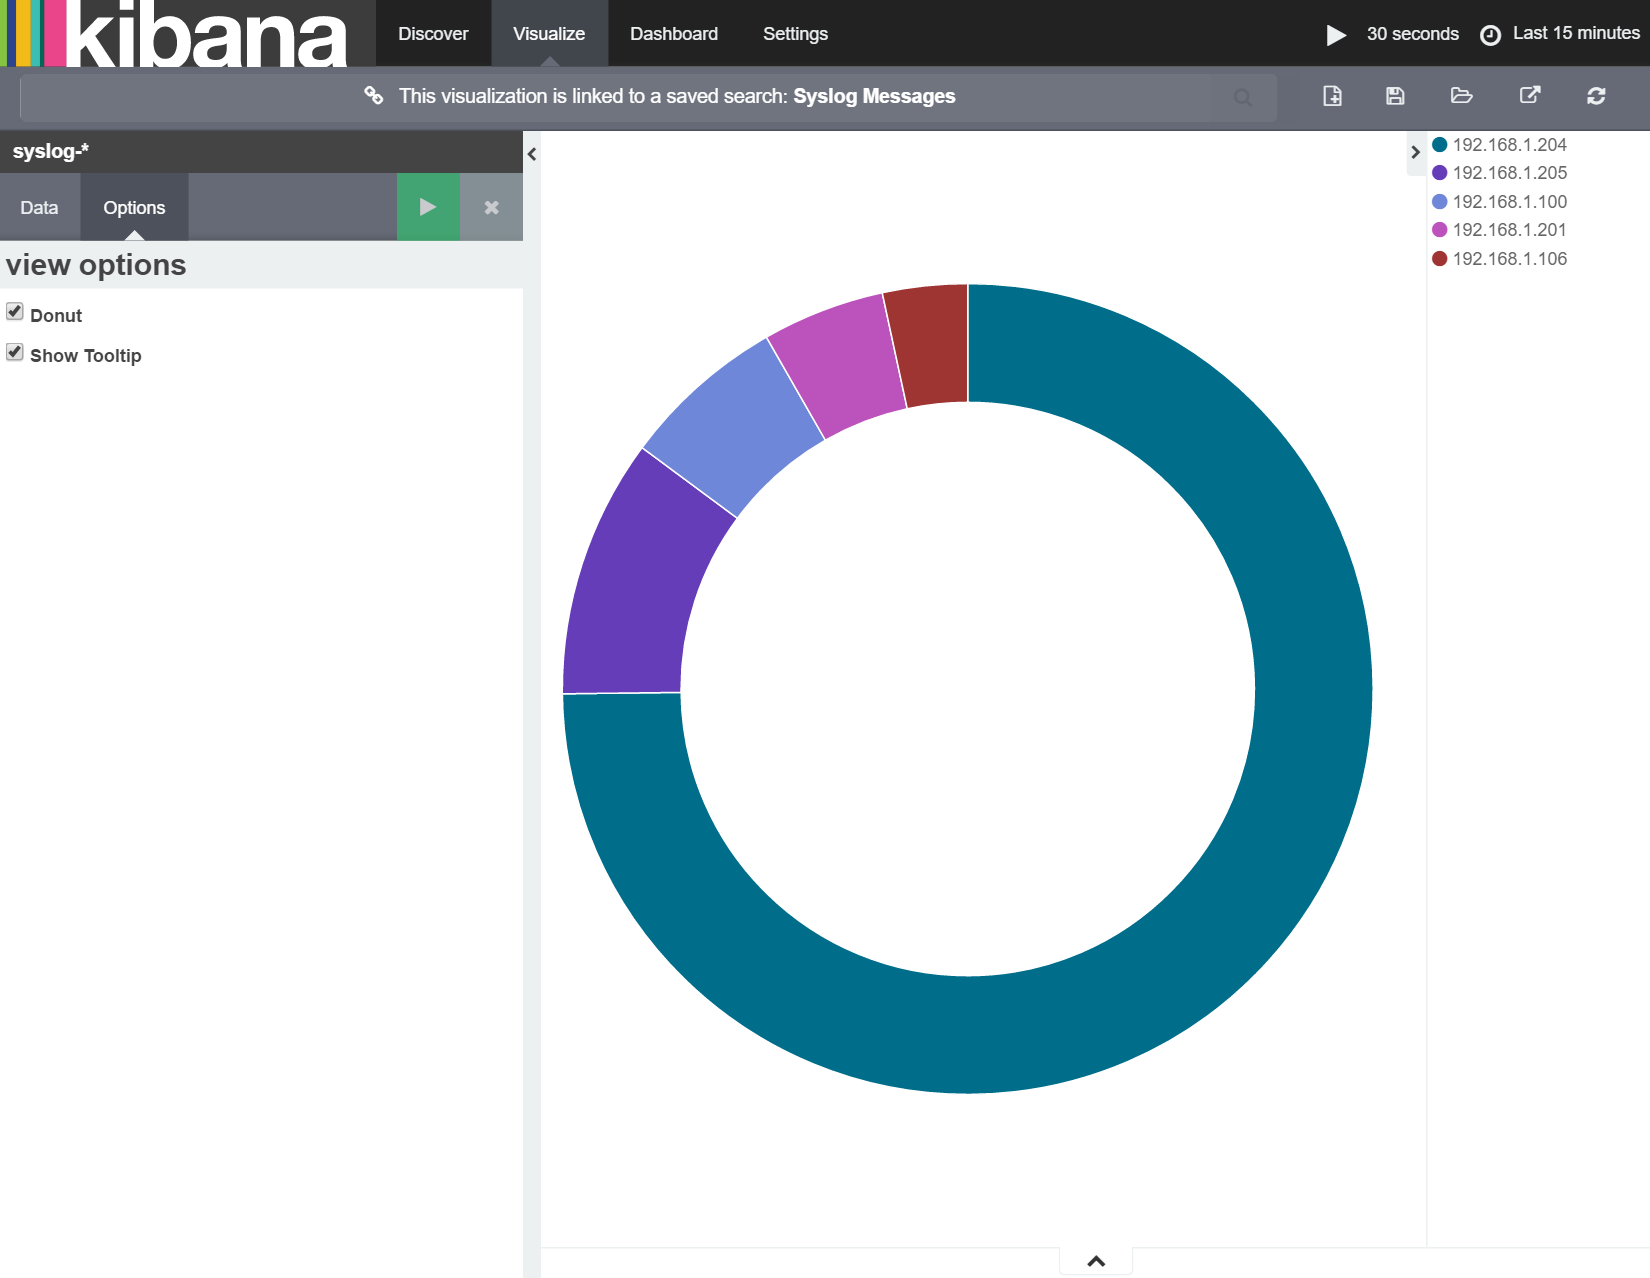
I'll then turn this into a donut chart by ticking the 'Donut' check box from the 'Options' area as shown below:
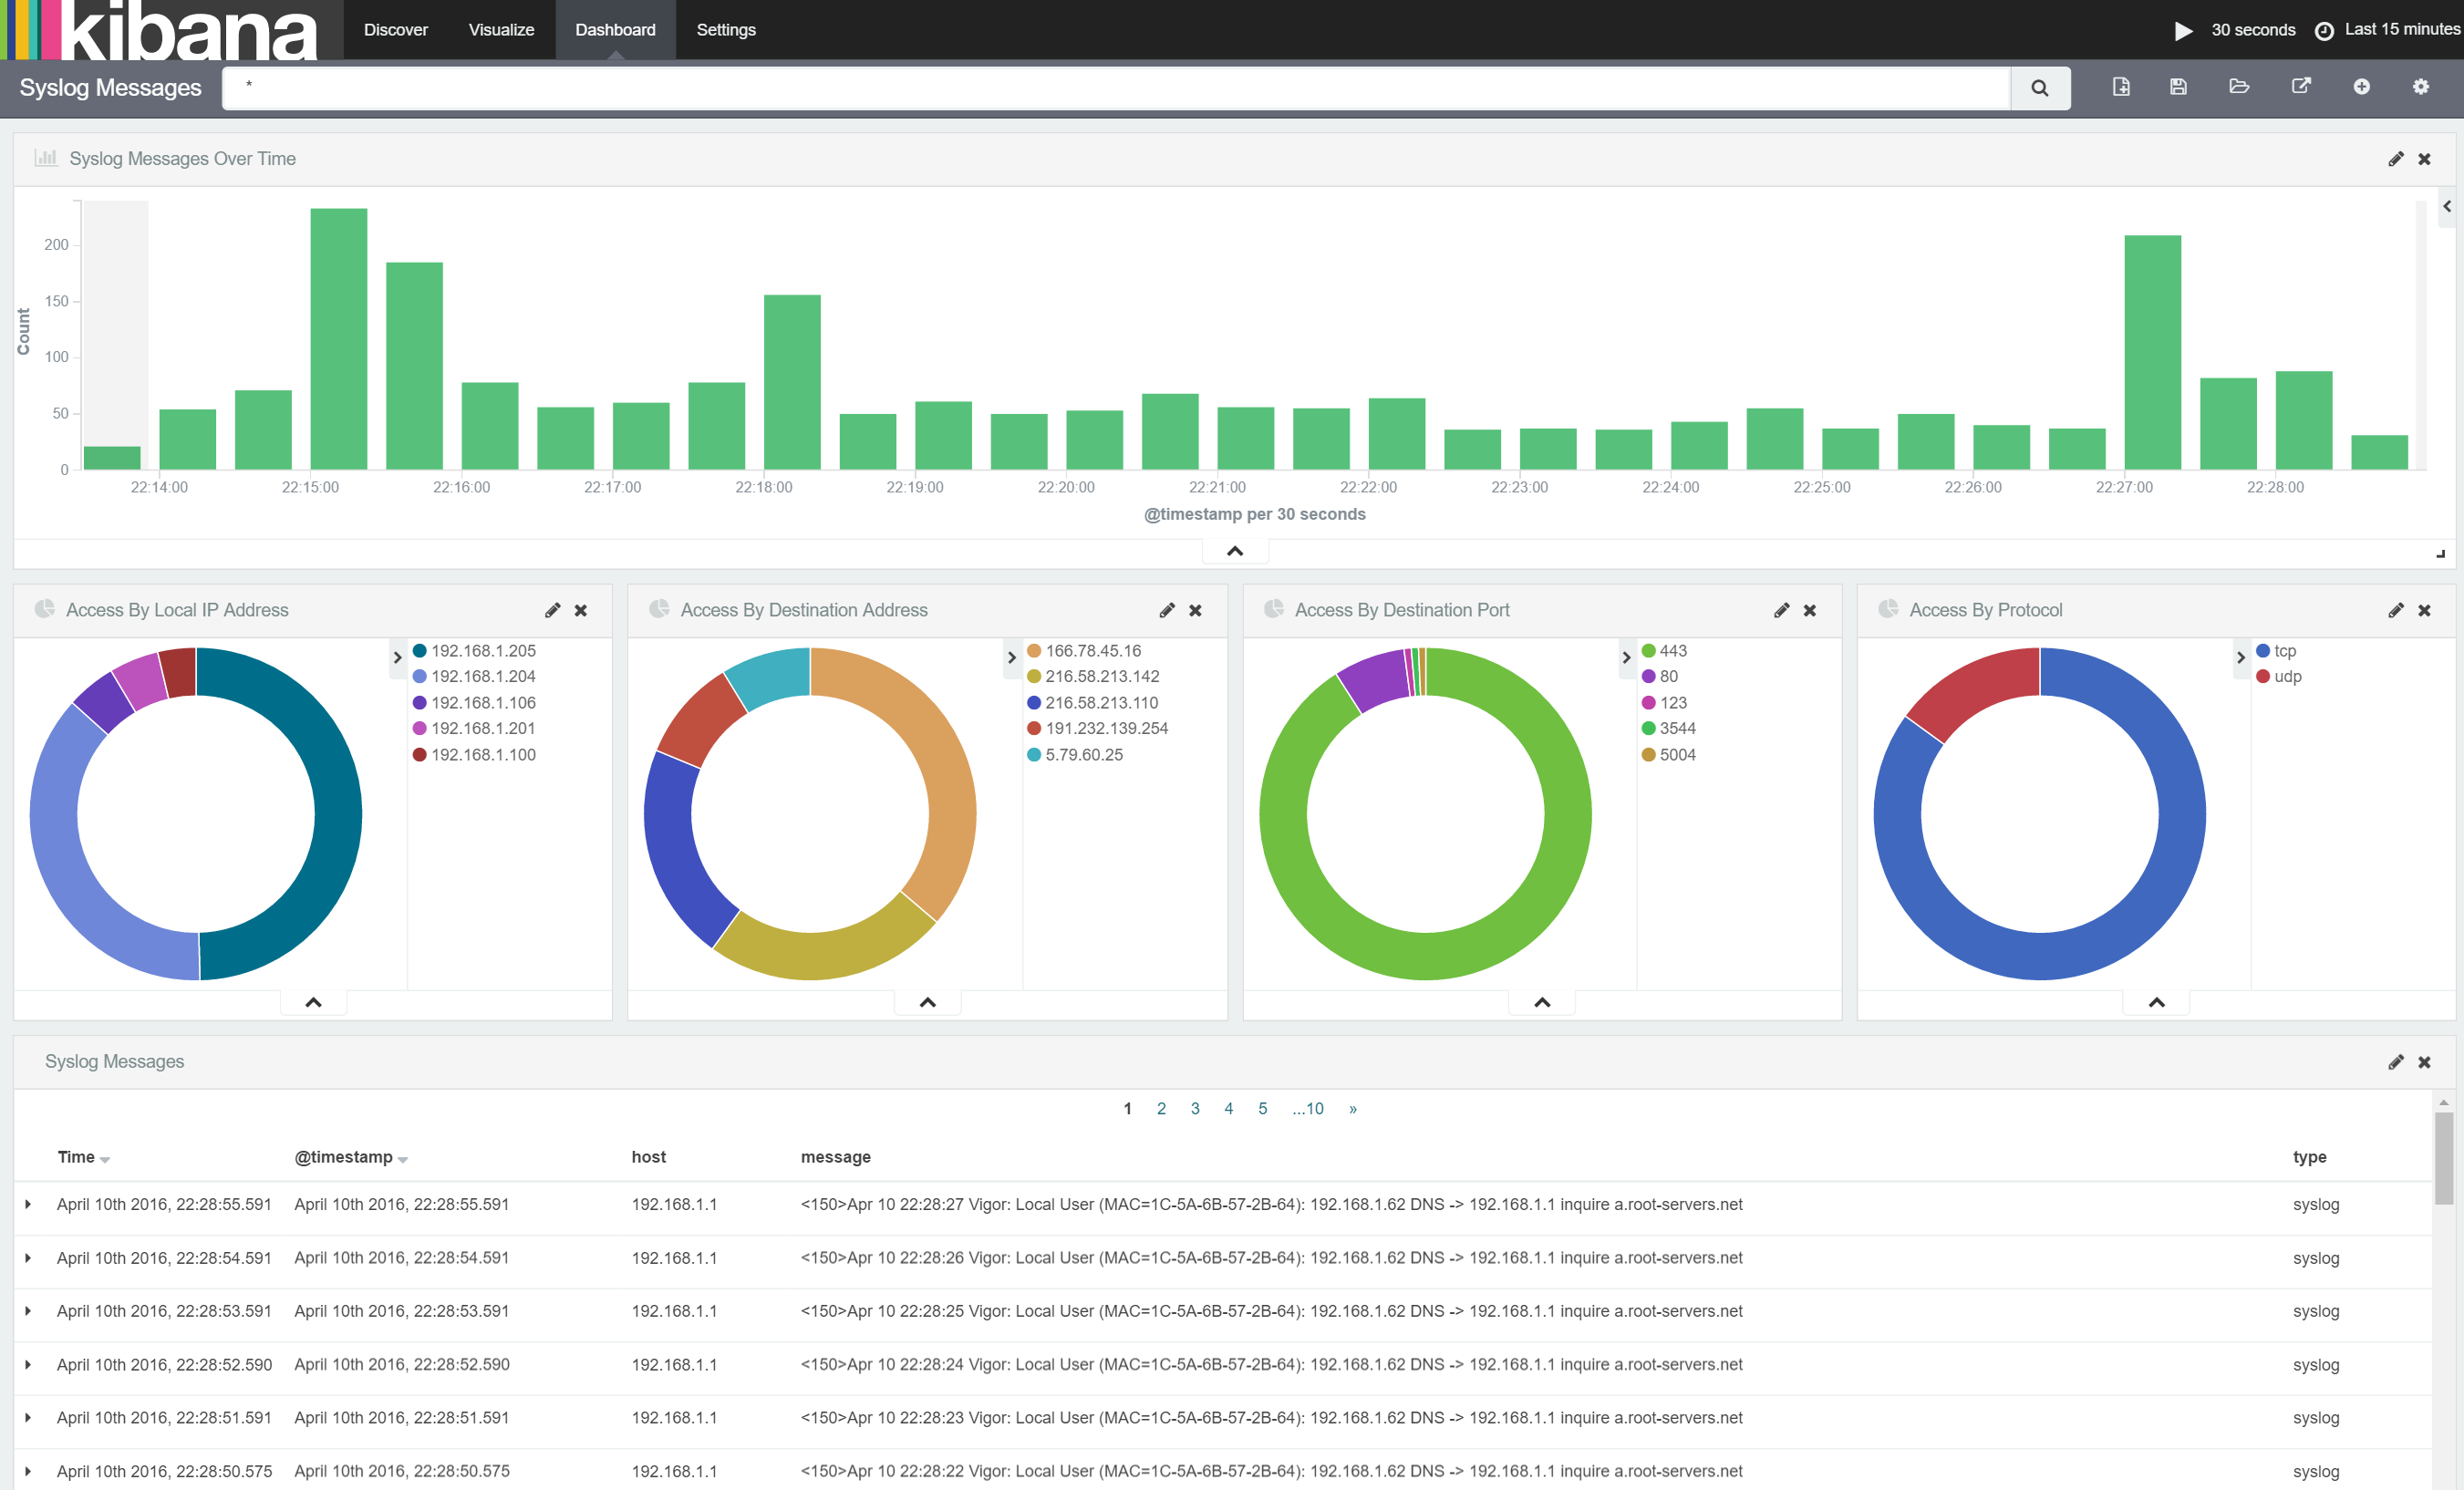
Now I'll use the same process for adding donut charts for each of the other metrics outlined above and add all the charts to my dashboard giving me the following:
summary
In this post, I showed how to extract structured information from unstructured text data in our source message. I then showed how this can be used within Kibana to highlight which devices on the local network are accessing which remote servers, on which ports and using which protocols.
In the next post, I'll examine how to further enhance the information we've extracted from the access messages to make it easier to relate ip address to actual devices on the network and out in the world.