Home networks are becoming increasingly complex. It is no longer just geeks and techies who have pervasive WiFi through-out their home to which a myriad of devices connect and communicate. When things go wrong or, worse still, the network is compromised by rouge hardware or software it's extremely difficult to work out what has happened and where to start troubleshooting the issue.
In the next few posts, I'm going to be showing how I used free and open-source software to build a home network monitoring solution that allows me to:
- Monitor the devices on my networks
- Monitor my network connectivity and utilisation
- Monitor which devices are connecting to which remote sites.
These posts will use the following components:
- An internet router capable of sending Syslog messages
- A mid-spec (i.e. dual-core 2Ghz) server with plenty of storage
- Java Runime Environment installed on the server
- The ElasticSearch stack consisting of:
- Logstash (I will be using v2.4.1)
- ElasticSearch (I will be using v2.4.1)
- Kibana (I will be using v4.5.0)
the router
At the core of my solution is a router that supports writing Syslog messages to a Syslog server. While once a rarity, this functionality is becoming increasingly prevalent in home / SOHO routers. Personally I use a DrayTek Vigor 2830, a versatile and - most importantly - extremely reliable router that can be purchased for just over £100 in the UK.
From the router administration web interface, you can set the router to write a variety of Syslog messages to a Syslog server by specifying the servers IP address. This can be seen below:
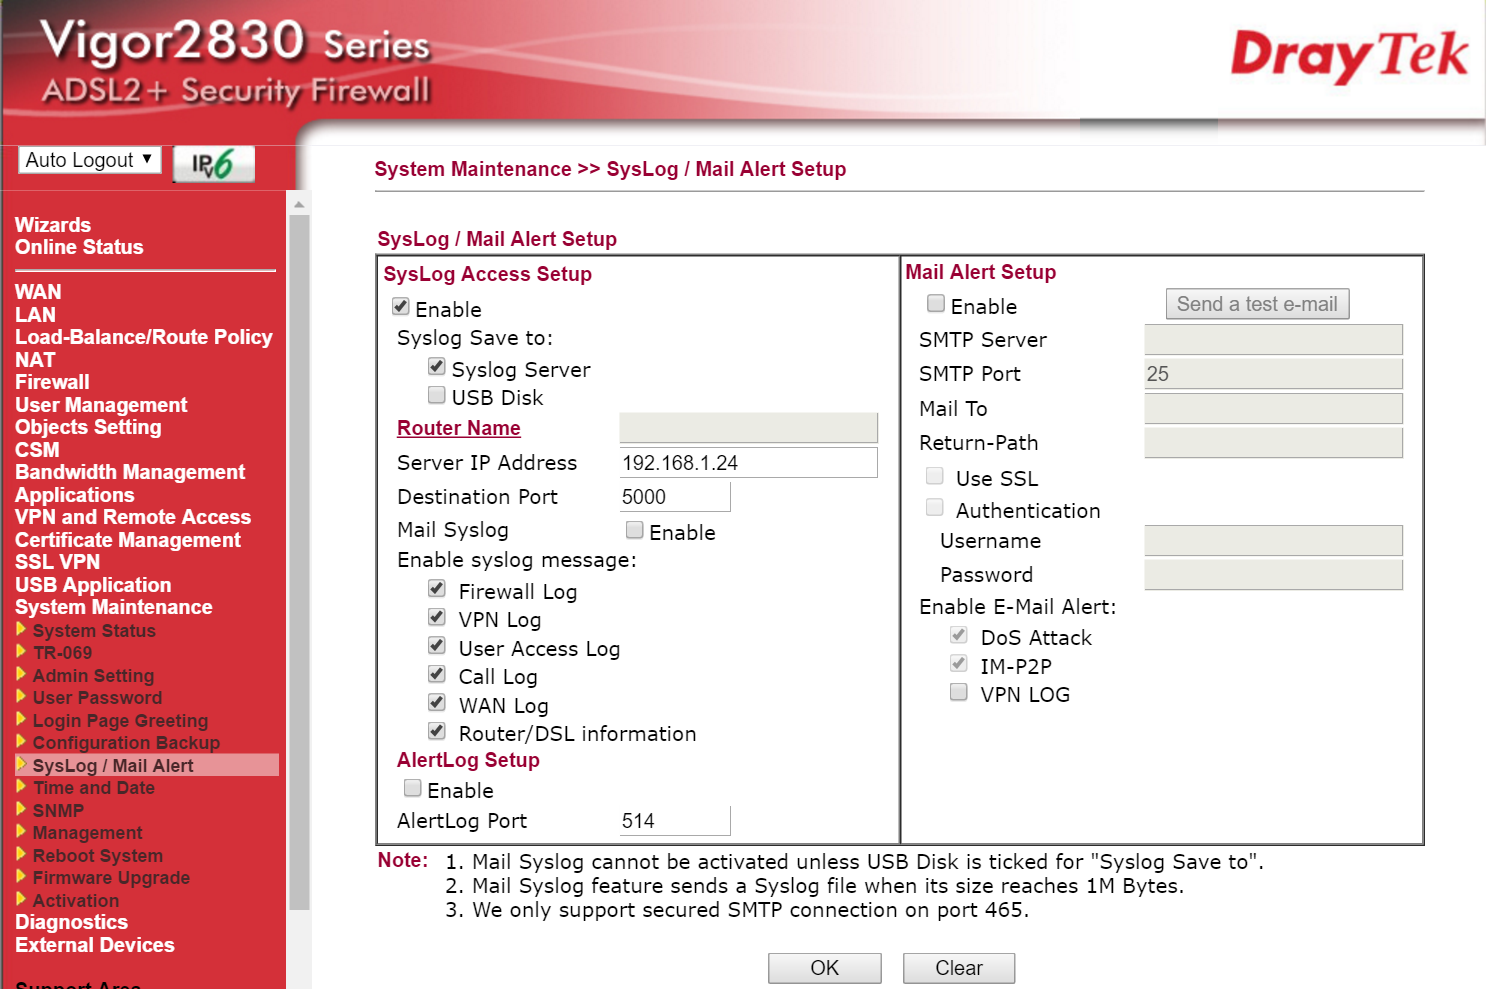
I simply tick all the boxes and add the IP address of the PC hosting the Syslog server.
the syslog server
Now we have a router that is sending connectivity information via Syslog, we need a service running on a server that is capable of receiving these messages. For this I am using Elastic's Logstash to receive the syslog messages and enrich them before forwarding them to an indexed store.
Logstash is an extremely versatile tool capable of consuming data from a variety of sources. A configuration file is used to set up a pipeline of inputs, operations (known as filters) and outputs which can do some truly fantastic things. If you're new to Logstash it might be worthwhile giving the ("Getting Started")[https://www.elastic.co/guide/en/logstash/current/getting-started-with-logstash.html] guide a quick read.
To start with, we'll get Logstash to simply accept Syslog input from a given port and write it to the console. To do this, simply download Logstash and extract it to a directory on the PC. Next, open notepad and copy paste the following:
input {
  tcp {
    port => 5000
    type => syslog
  }
  udp {
    port => 5000
    type => syslog
  }
}

filter {
}

output {
  stdout {
  }
}
Save this file named 'Syslog.config' and, from a command prompt, start Logstash with the following command:
[LogStashDirectory]\bin\logstash.bat agent -f [ConfigFilePath]\Syslog.config
If all goes well, you should see Logstash start receiving Syslog messages from the router which should appear something like the following:
io/console not supported; tty will not be manipulated
Settings: Default pipeline workers: 2
Pipeline main started
2016-04-08T13:52:21.903Z 192.168.1.1 <150>Apr  8 14:51:59 Vigor: Local User (MAC=ZZ-ZZ-ZZ-ZZ-ZZ-ZZ): 192.168.1.62 DNS -> 192.168.1.1 inquire a.root-servers.net
2016-04-08T13:52:22.528Z 192.168.1.1 <150>Apr  8 14:51:59 Vigor: Local User (MAC=ZZ-ZZ-ZZ-ZZ-ZZ-ZZ): 192.168.1.51 DNS -> 192.168.1.1 inquire api-global.netflix.com
2016-04-08T13:52:22.528Z 192.168.1.1 <150>Apr  8 14:51:59 Vigor: Local User (MAC=ZZ-ZZ-ZZ-ZZ-ZZ-ZZ): 192.168.1.51 DNS -> 213.120.234.54 inquire api-global.netflix.com
2016-04-08T13:52:22.903Z 192.168.1.1 <150>Apr  8 14:52:00 Vigor: Local User (MAC=ZZ-ZZ-ZZ-ZZ-ZZ-ZZ): 192.168.1.62 DNS -> 192.168.1.1 inquire a.root-servers.net
2016-04-08T13:52:24.356Z 192.168.1.1 <150>Apr  8 14:52:01 Vigor: Local User (MAC=ZZ-ZZ-ZZ-ZZ-ZZ-ZZ): 192.168.1.100 DNS -> 192.168.1.1 inquire sls.update.microsoft.com
2016-04-08T13:52:24.356Z 192.168.1.1 <150>Apr  8 14:52:01 Vigor: Local User (MAC=ZZ-ZZ-ZZ-ZZ-ZZ-ZZ): 192.168.1.100 DNS -> 213.120.234.54 inquire sls.update.microsoft.com
2016-04-08T13:52:24.356Z 192.168.1.1 <158>Apr  8 14:52:01 Vigor: Load_balance 192.168.1.100 --(DNS)--> 213.120.234.54 go WAN1
2016-04-08T13:52:24.731Z 192.168.1.1 <150>Apr  8 14:52:01 Vigor: Local User (MAC=ZZ-ZZ-ZZ-ZZ-ZZ-ZZ): 192.168.1.100:53432 -> 157.56.77.138:443 (TCP)
2016-04-08T13:52:24.731Z 192.168.1.1 <158>Apr  8 14:52:01 Vigor: Load_balance 192.168.1.100 --(BAL)--> 157.56.77.138 go WAN1
If you're not receiving Syslog messages try the following:
- Ensure to check the firewall settings on the server you're using. You need to allow incomming TCP and UDP connections on port 5000.
- Attempt to telnet to port 5000 on the Syslog server. If Logstash is running correctly, you should be able to connect and see anything you sent from Telnet mirrored in the Logstash console window.
- If you're still unable to see any output, try using a network analysis too like Wireshark to see if your router is actually sending any messages.
the syslog store
Now we're able to receive Syslog messages, we need to store and index them. For this, we will use ElasticSearch. Simply download ElasticSearch, extract it to a directory and start it. If necessary you can change the directory used to store ElasticSearch data or the interface/port on which ElasticSearch listens for incomming connections by modifying the config\ElasticSearch.yml file. Modifying this file is pretty straight forward but for help the ElasticSearch documentation is available online and very thorough.
Additionally, rather than having to manually start ElasticSearch everytime you want to use it, you can easily install it as a Windows service simply - as I have done - by issuing the following commands from a command prompt:
[PathToElasticSearch]\bin\service.bat install
[PathToElasticSearch]\bin\service.bat start
ElasticSearch should no be running. You can check this calling REST methods on ElasticSearch's web interface; by default on port 9200. In a browser, simple enter http://[server-ip]:9200 and you should see something like the following:
"name" : "Shellshock",
"cluster_name" : "cluster",
"version" : {
  "number" : "2.3.1",
  "build_hash" : "bd980929010aef404e7cb0843e61d0665269fc39",
  "build_timestamp" : "2016-04-04T12:25:05Z",
  "build_snapshot" : false,
  "lucene_version" : "5.5.0"
},
"tagline" : "You Know, for Search"
}
NOTE: You will be using the REST API extensively in future steps so I suggest finding a toolset that make querying and posting to REST endpoints easier. I use the excellent
PostmanChrome application.
With ElasticSearch running, we now need to modify Logstash to forward Syslog messages to ElasticSearch for indexing. As both tools are part of the Elastic Stack, this is every bit as easy as you might expect it to be. Simply open the syslog.config file we created earler and change it to the following:
input {
  tcp {
    port => 5000
    type => syslog
  }
  udp {
    port => 5000
    type => syslog
  }
}

filter {
}

output {
  elasticsearch {
    hosts => ["[ElasticSearchServer-NameOrIPAddress]:9200"]
    index => "syslog-%{+YYYY.MM.dd}"
  }
}
With this in place, restart the Logstart service and, instead of writing received messages to the console, they will be stored in ElasticSearch.
the dashboard
Now we have syslog messages in a central store, we will look how to set up a simple (for now) dashboard that lets us see a minimally useful feature: the number of Syslog messages being received over time.
In order to do this, we will be using ElasticSearch's Kibana tool to query messages from ElasticSearch and display a histogram of messages on a dashboard. To get started, simply download and extract Kibana to a directory on the server. Kibana comes with a default configuration that allows it to run correctly when co-located on the same server as ElasticSearch. If you are not running Kibana on the same server as ElasticSearch, you will need to modify the Kibana configuration file as described in the documentation.
To start Kibana, simply open a command prompt and execute the following command:
[PathToKibana]\bin\Kibana.bat
You should see something like the following:
log   [15:51:32.912] [info][status][plugin:kibana] Status changed from uniniti
alized to green - Ready
log   [15:51:32.975] [info][status][plugin:elasticsearch] Status changed from
uninitialized to yellow - Waiting for Elasticsearch
log   [15:51:33.006] [info][status][plugin:kbn_vislib_vis_types] Status change
d from uninitialized to green - Ready
log   [15:51:33.022] [info][status][plugin:markdown_vis] Status changed from u
ninitialized to green - Ready
log   [15:51:33.037] [info][status][plugin:metric_vis] Status changed from uni
nitialized to green - Ready
log   [15:51:33.053] [info][status][plugin:spyModes] Status changed from unini
tialized to green - Ready
log   [15:51:33.068] [info][status][plugin:statusPage] Status changed from uni
nitialized to green - Ready
log   [15:51:33.068] [info][status][plugin:table_vis] Status changed from unin
itialized to green - Ready
log   [15:51:33.100] [info][listening] Server running at http://0.0.0.0:5601
log   [15:51:38.131] [info][status][plugin:elasticsearch] Status changed from
yellow to yellow - No existing Kibana index found
log   [15:51:41.053] [info][status][plugin:elasticsearch] Status changed from
yellow to green - Kibana index ready
With Kibana started, use a browser to navigate to the Kibana web interface, typically on port 5601.
NOTE: If you are connected to Kibana from another PC, you will need to open firewall port 5602 on the server to allow connections to Kibana.
After a short pause while Kibana is initialised, you should see the following screen:
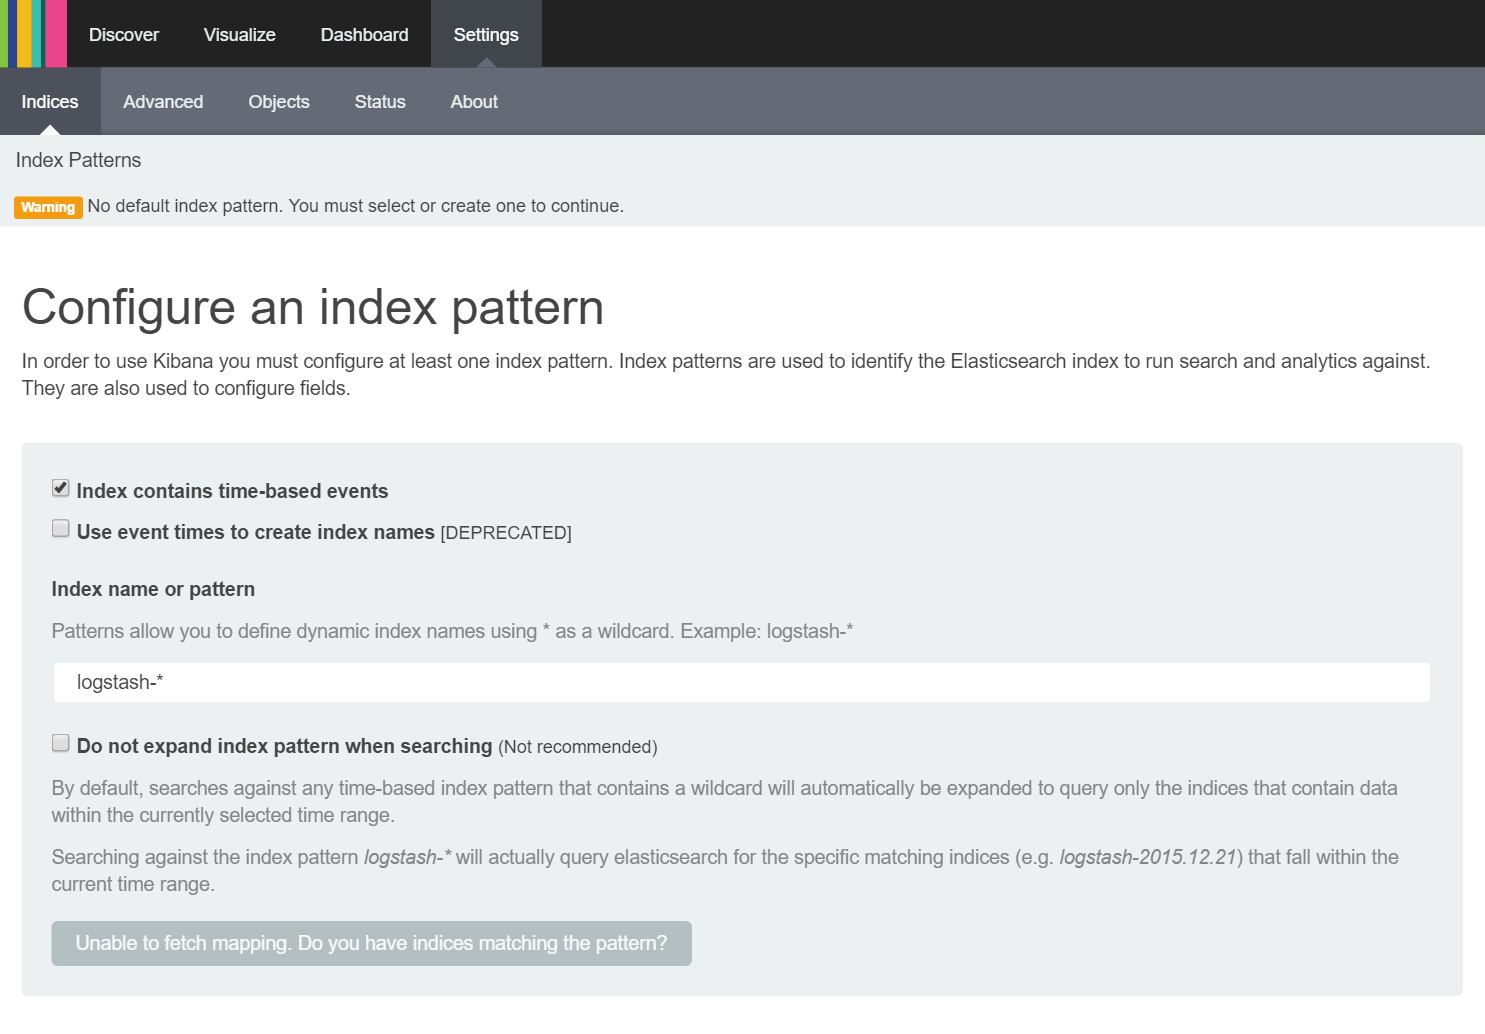
This screen allows you to add an index to Kibana that it can query messages in order to discover, visualise and ultimately produce a dashboard from information stored in the index. It is currently set to examine an index called logstash-* and shows a disable button at the bottom of the screen containing the text 'Unable to fetch mapping. Do you have indices matching the pattern' as we do not have a logstash index stored in ElasticSearch. We want Kibana to query our Syslog index so we change the 'Index name or pattern' to Syslog-* and, shortly after changing this value, we should see the button at the bottom change to 'Create' as shown here:
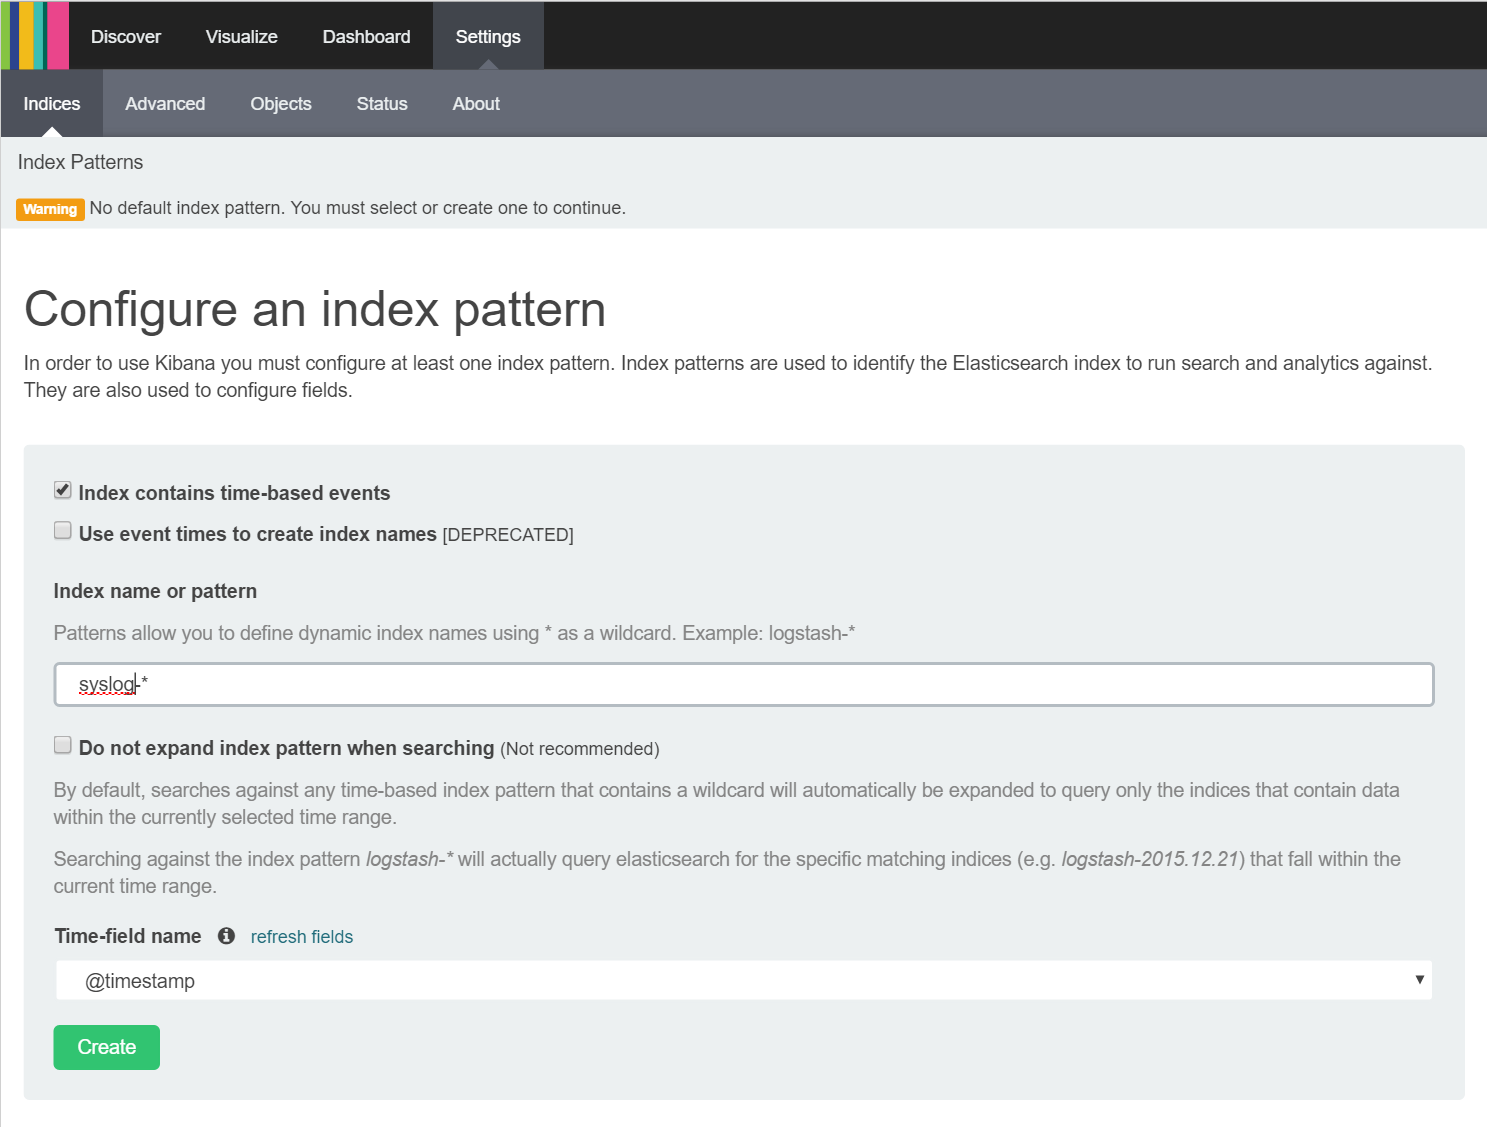
As Kibana has defaulted to the correct timestamp field (more on this later) you can simply click the 'Create' button to add the index to Kibana.
After creating the index, you are taken to a screen that allows you modify how Kibana displays the fields within the index as shown below:
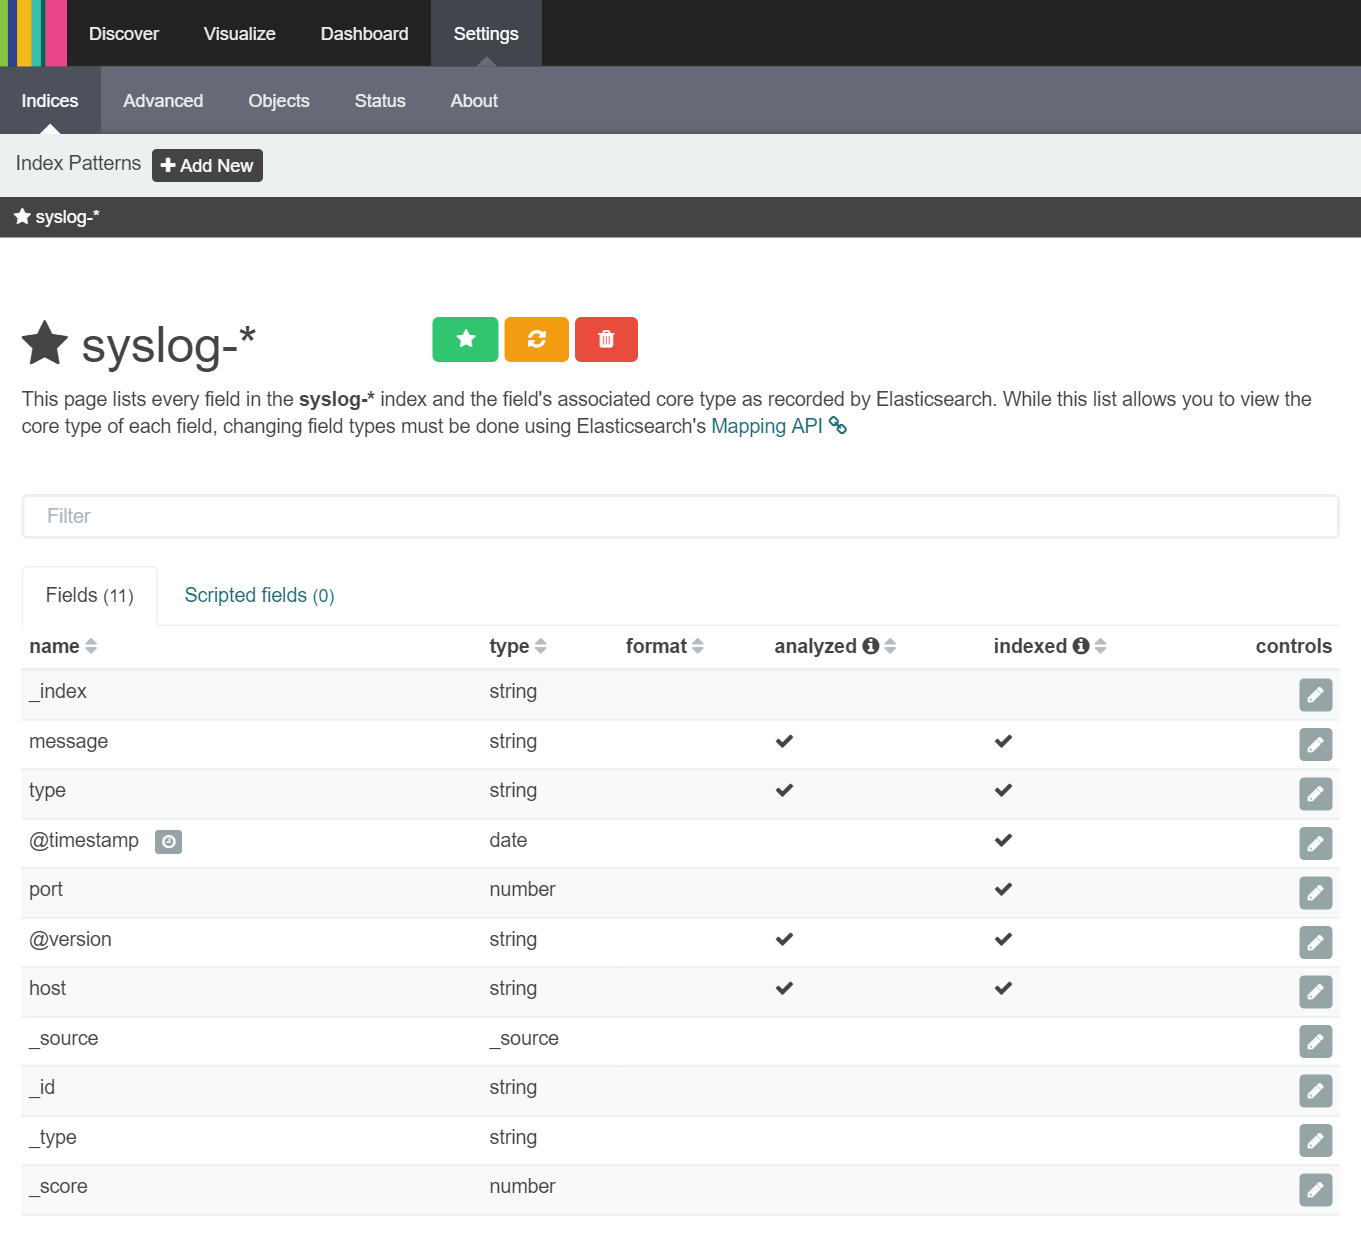
We do not need to change anything here so can immediately start 'discovering' information in our Syslog index by clicking the 'Discover' tab as shown below:
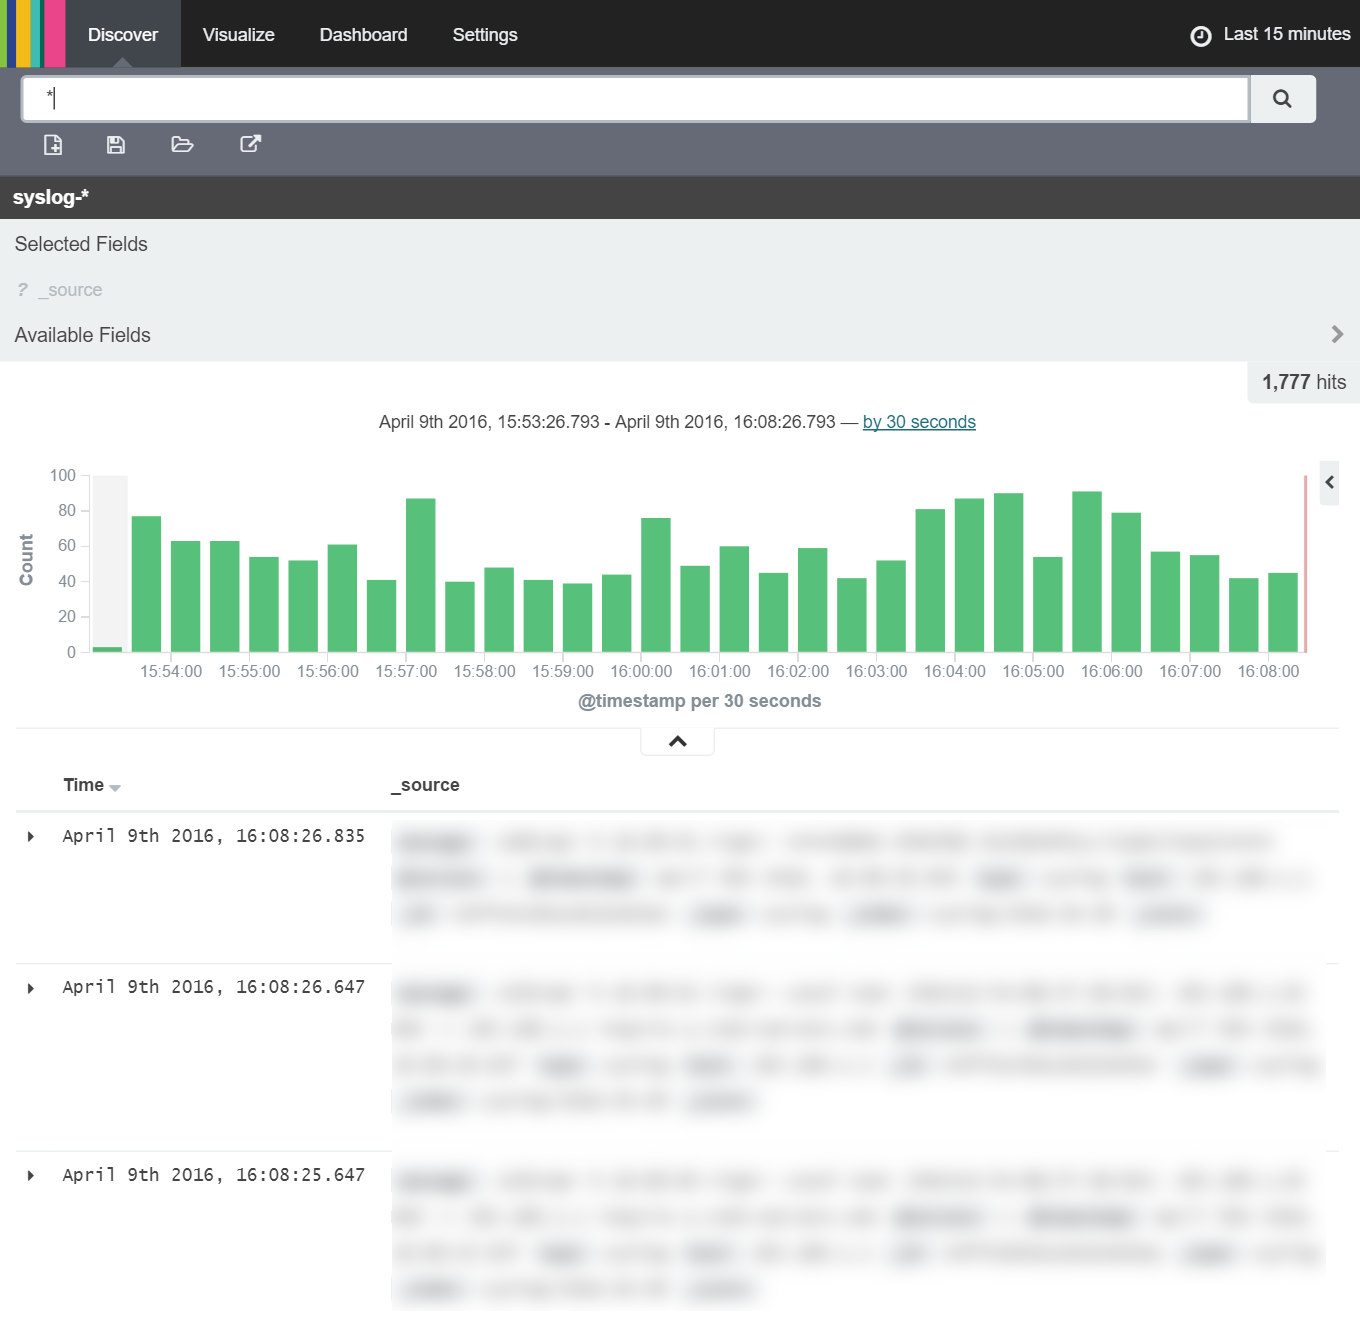
Here we're able to see the detail of the Syslog messages stored within the Syslog index on ElasticSearch. However, for now the messages are just strings so there's not a great deal we can do with them other than count them to produce a histogram of messages over time. To do this, we first want to add the fields of the index we're interested in (just timestamp, host, message and type for now) to the selected fields area as shown below:
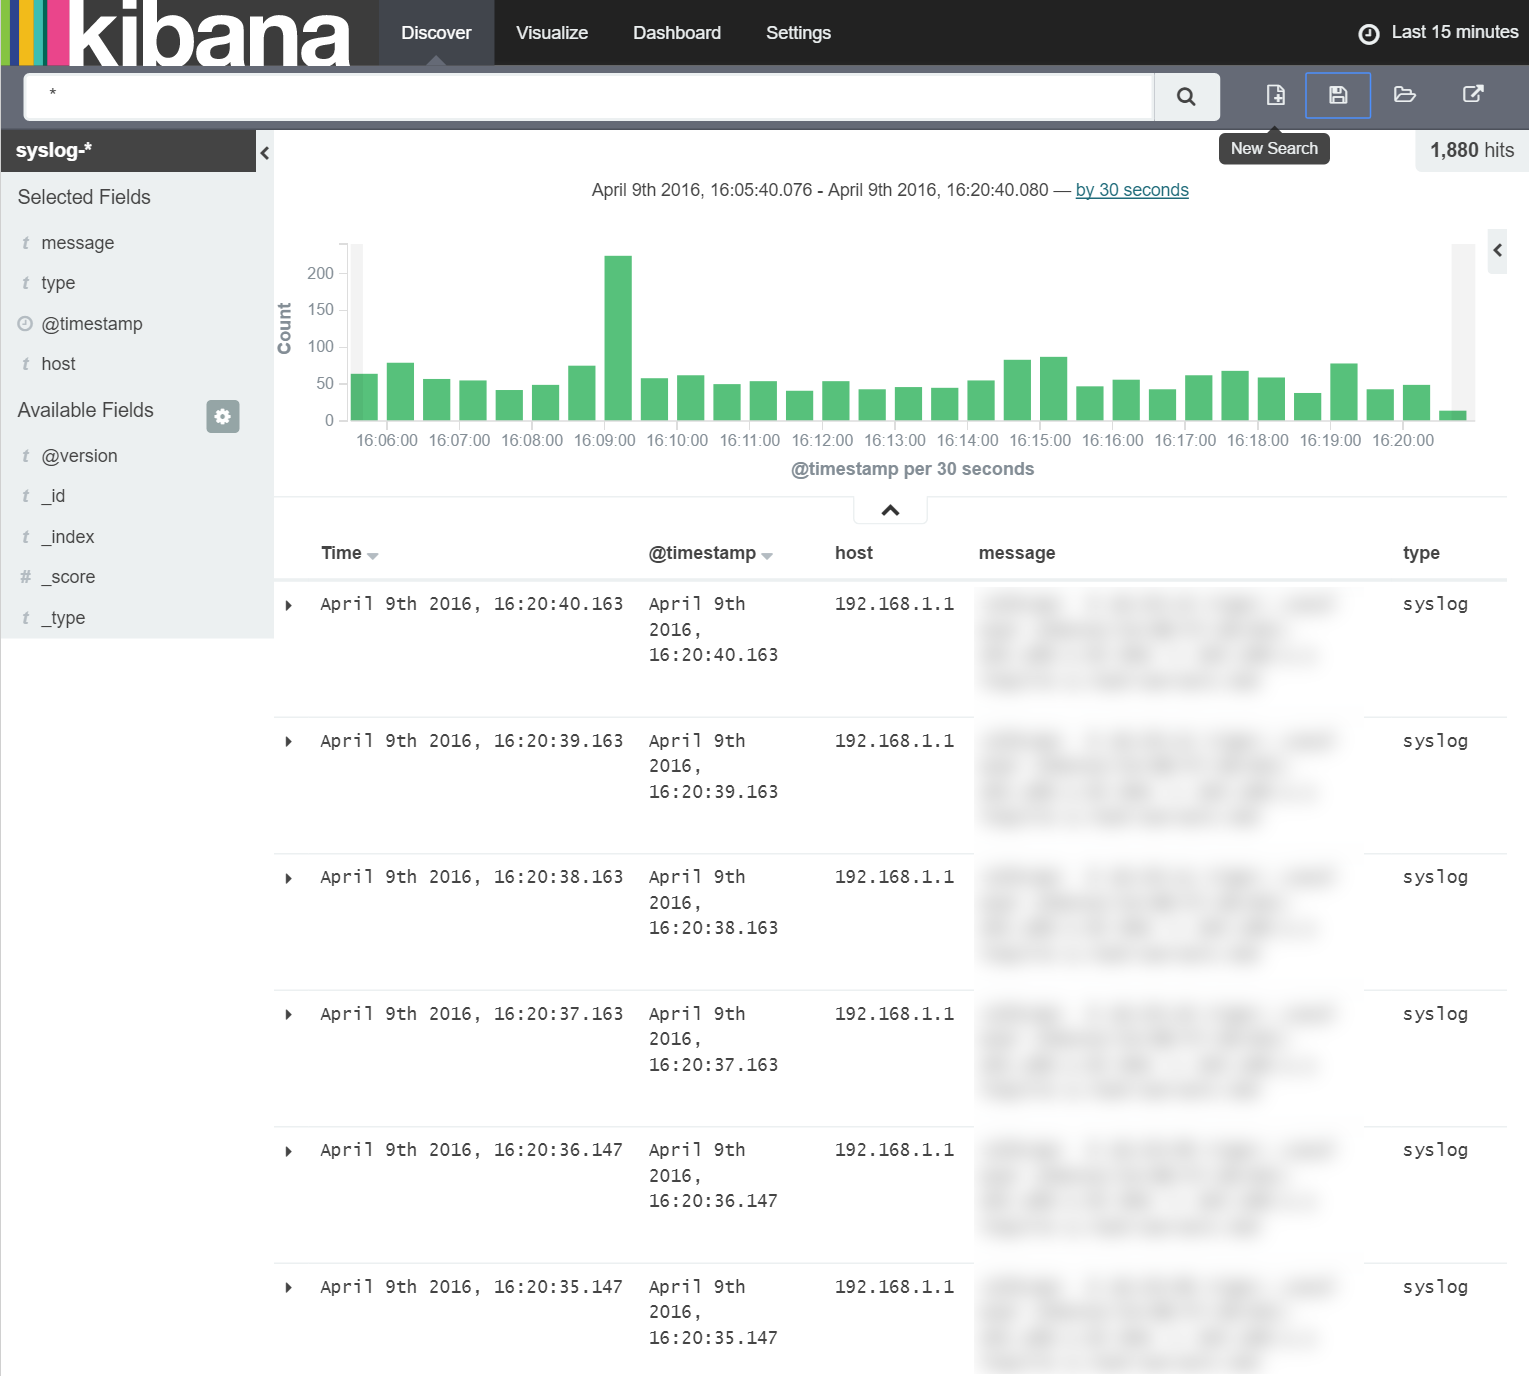
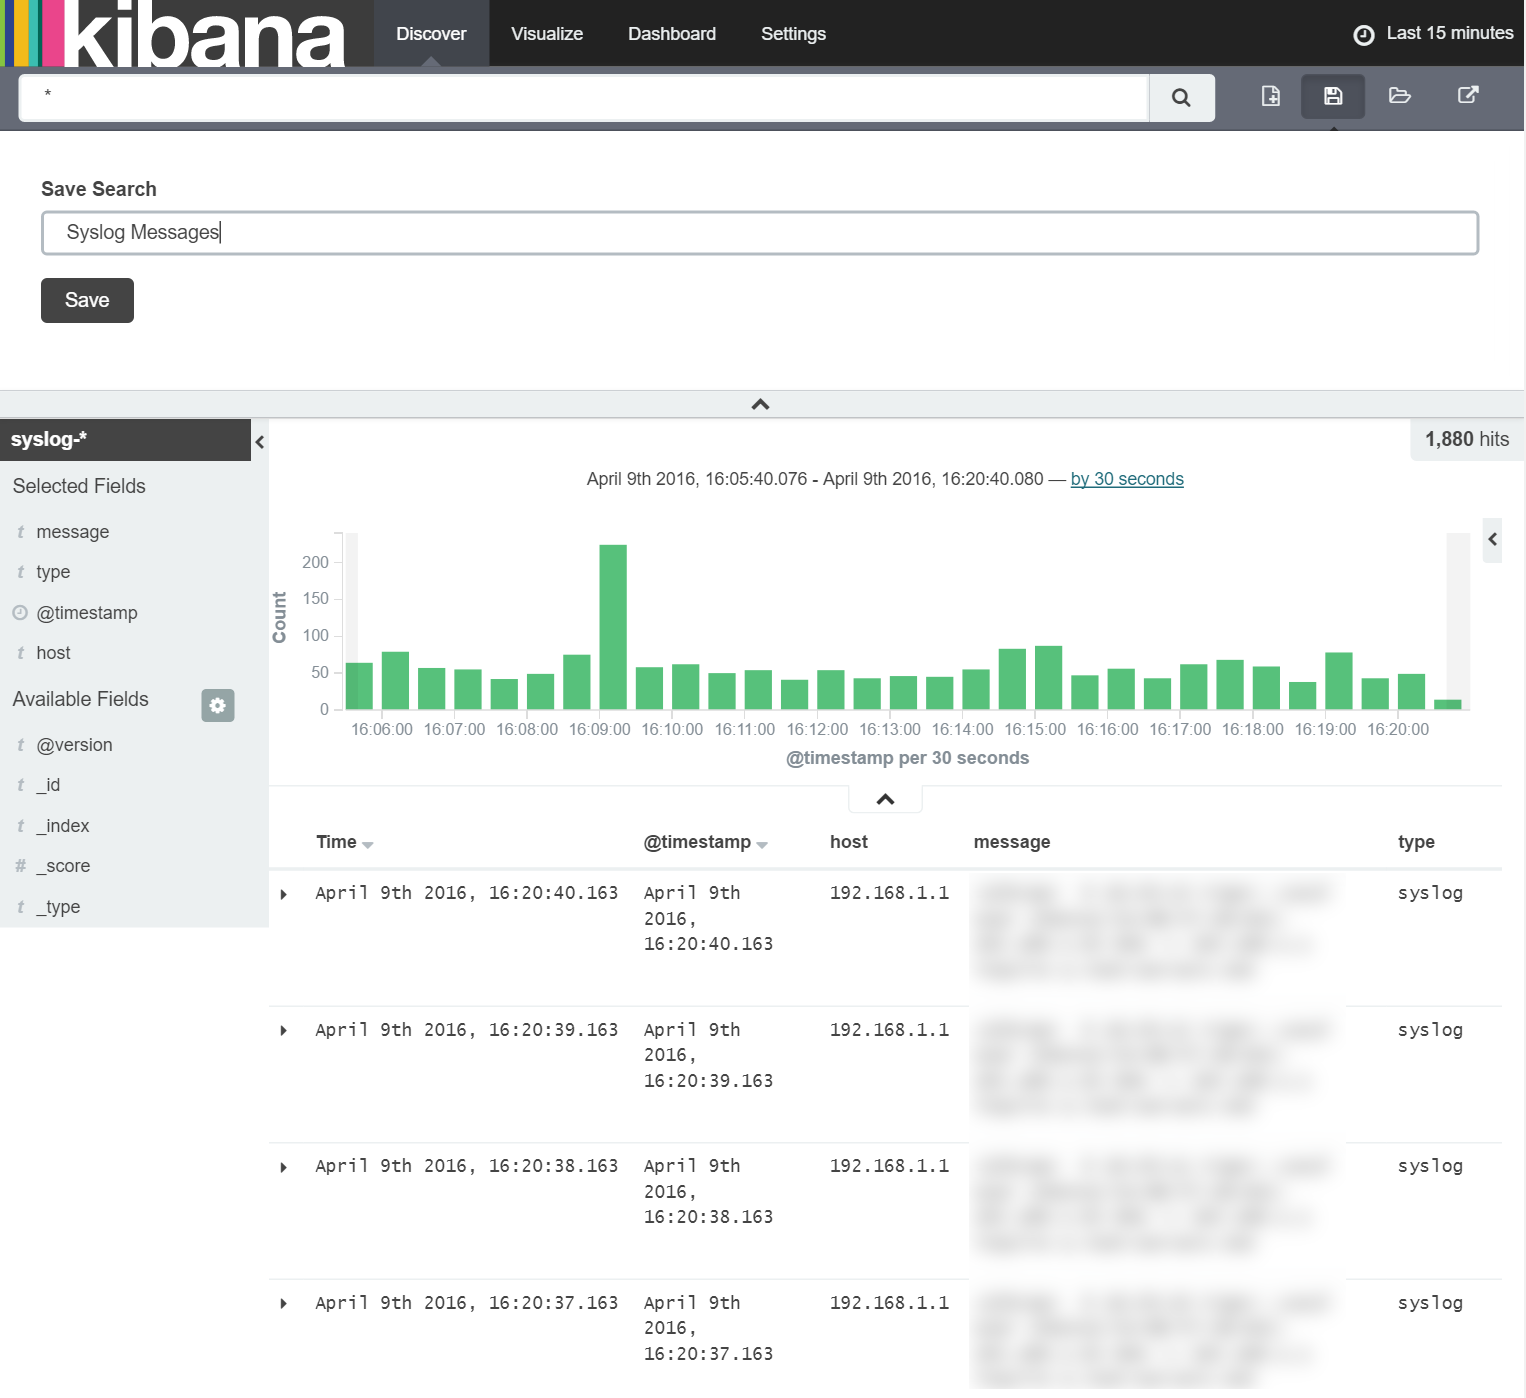
Once we have the fields we're interested in selected, we save them as a new search by clicking the 'Save Search' button in the top right of the window as shown below:
Once the search is saved, we can proceed straight to the 'Visualise' tab to create the histogram as shown below:
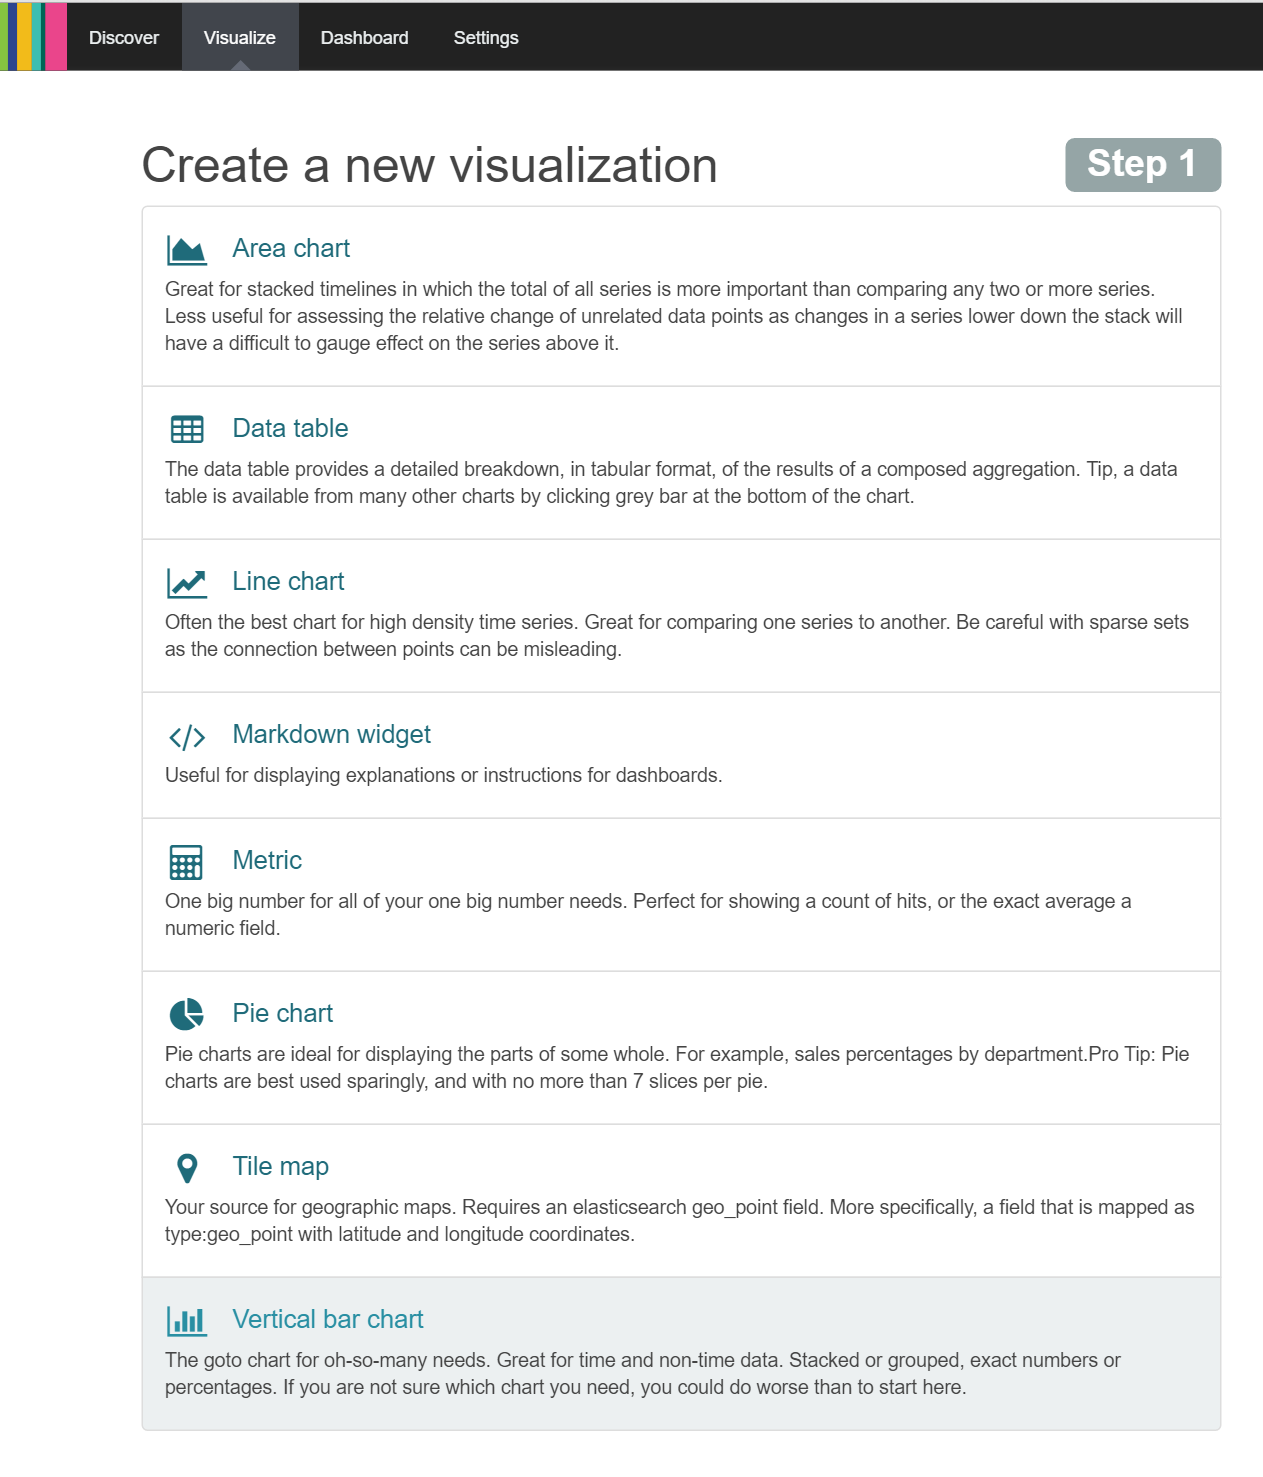
To create a histogram, we use a "Vertical bar chart". Note it's description:
The goto chart for oh-so-many needs. Great for time and non-time data. Stacked or grouped, exact numbers or percentages. If you are not sure which chart you need, you could do worse than to start here.
So lets start here by clicking this option and selecting 'From a saved search' as shown below:
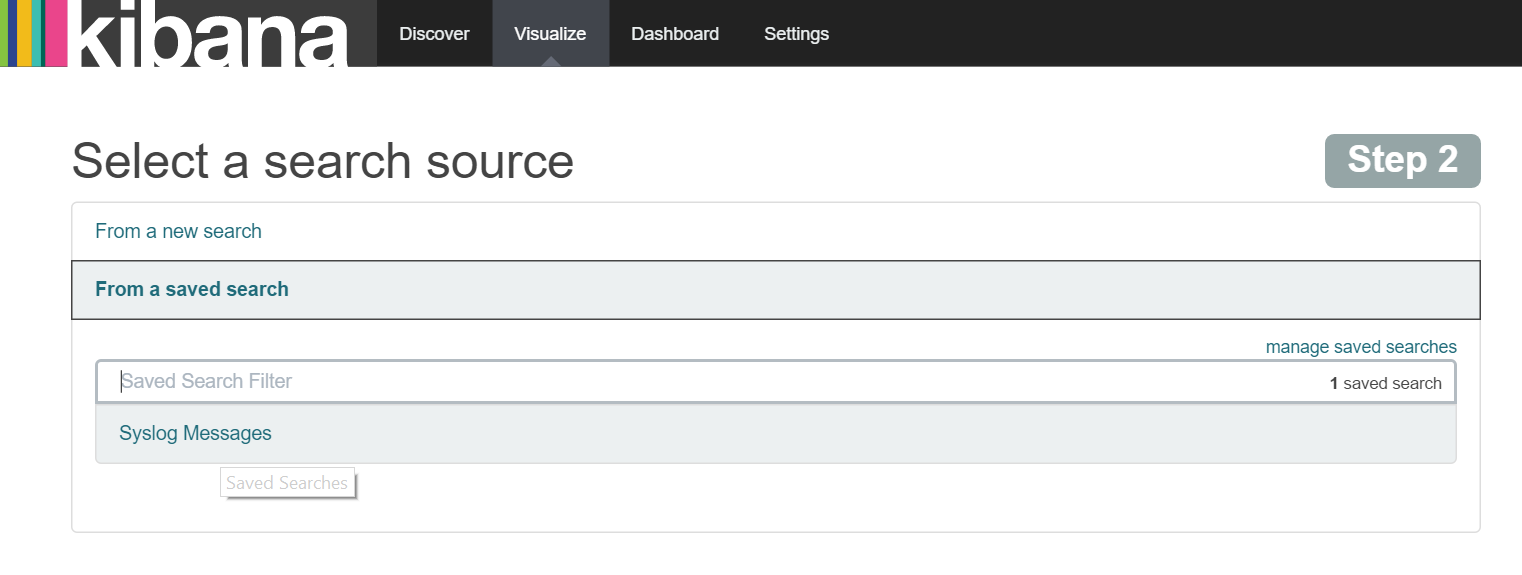
Once you select the 'Syslog Messages' save search you will immediately be taken to the Visualization screen with a vertical bar chart showing a single bar with the total count of all messages. Here we want to customise the visualisation to display the count of messages over time so we first need to define the X-axis as a 'Date Histogram' as shown below.
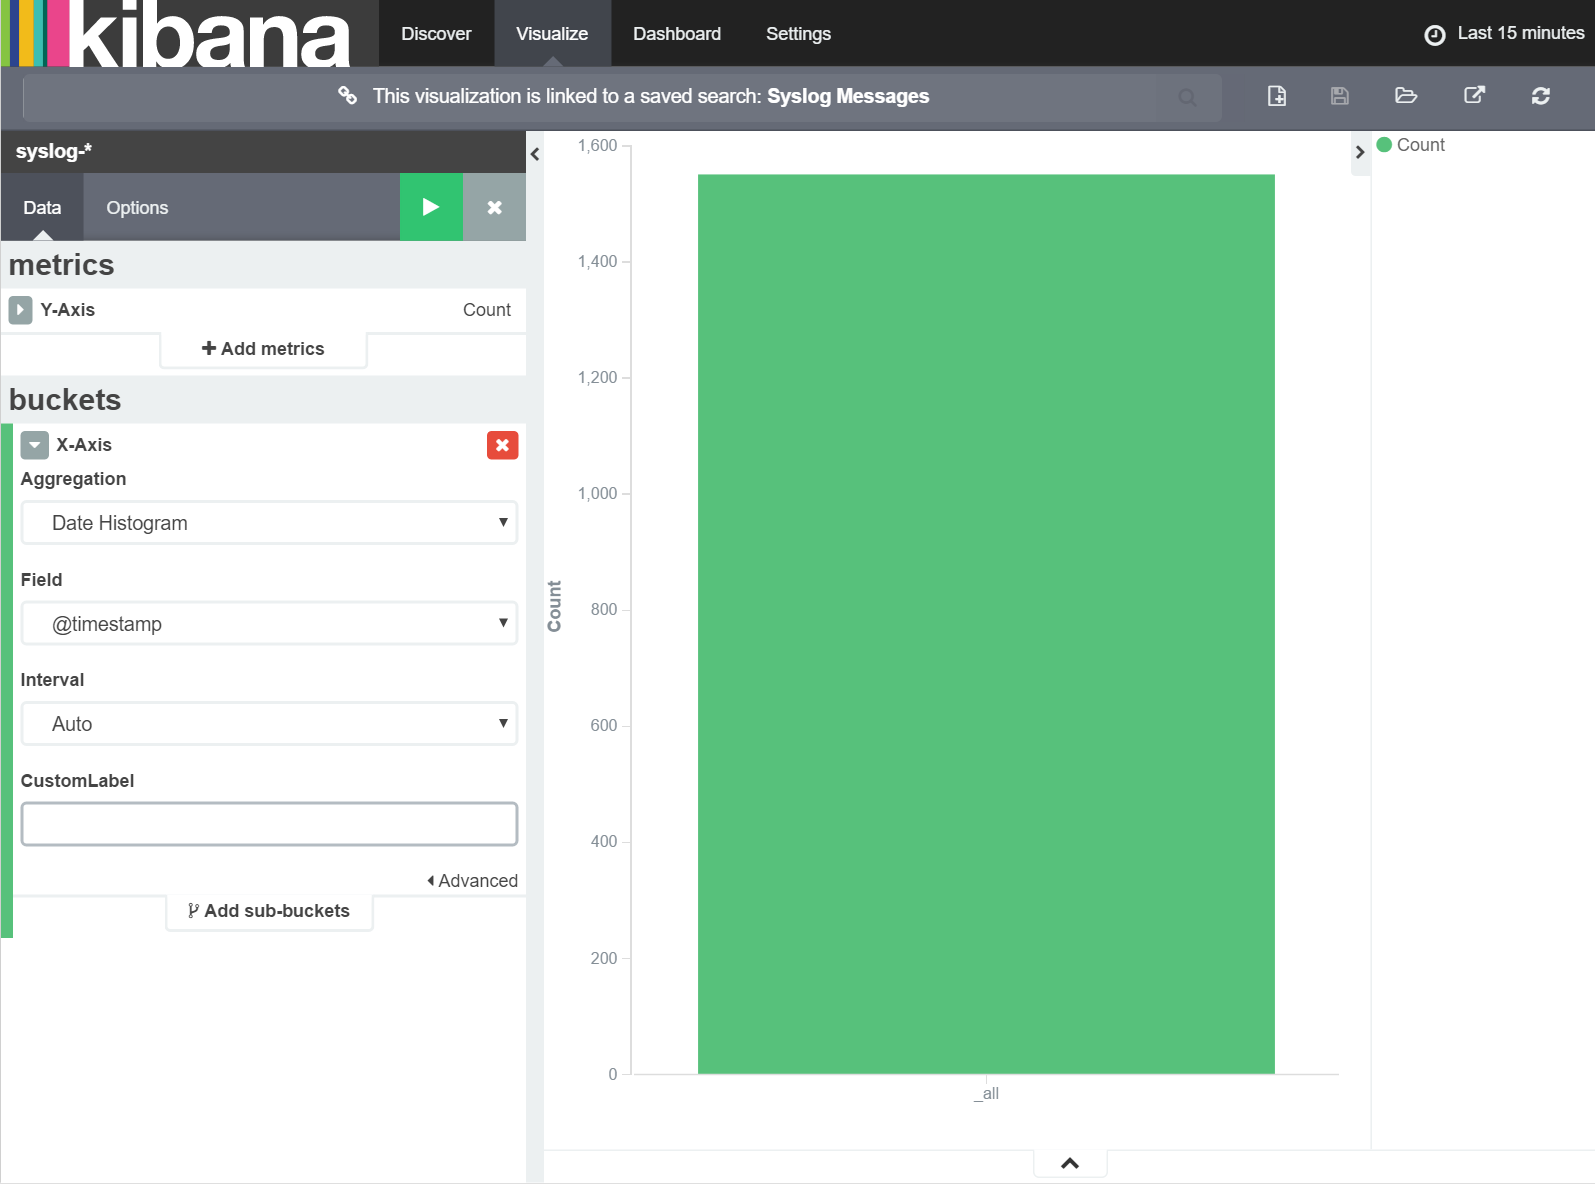
With these settings in place, click the 'Apply Changes' button and you should immediately see a chart of the count of syslog messages over time. Note that Kibana has automatically selected an appropriate resolution of column grouping (messages 'per 30 seconds' in the example above) but that this can be changed later if required.
For now, we want to add this chart to a new dashboard so we can have it available to us at a moments notice. To do this, we first save our visualization by clicking the 'Save Visuaization' button as shown below:
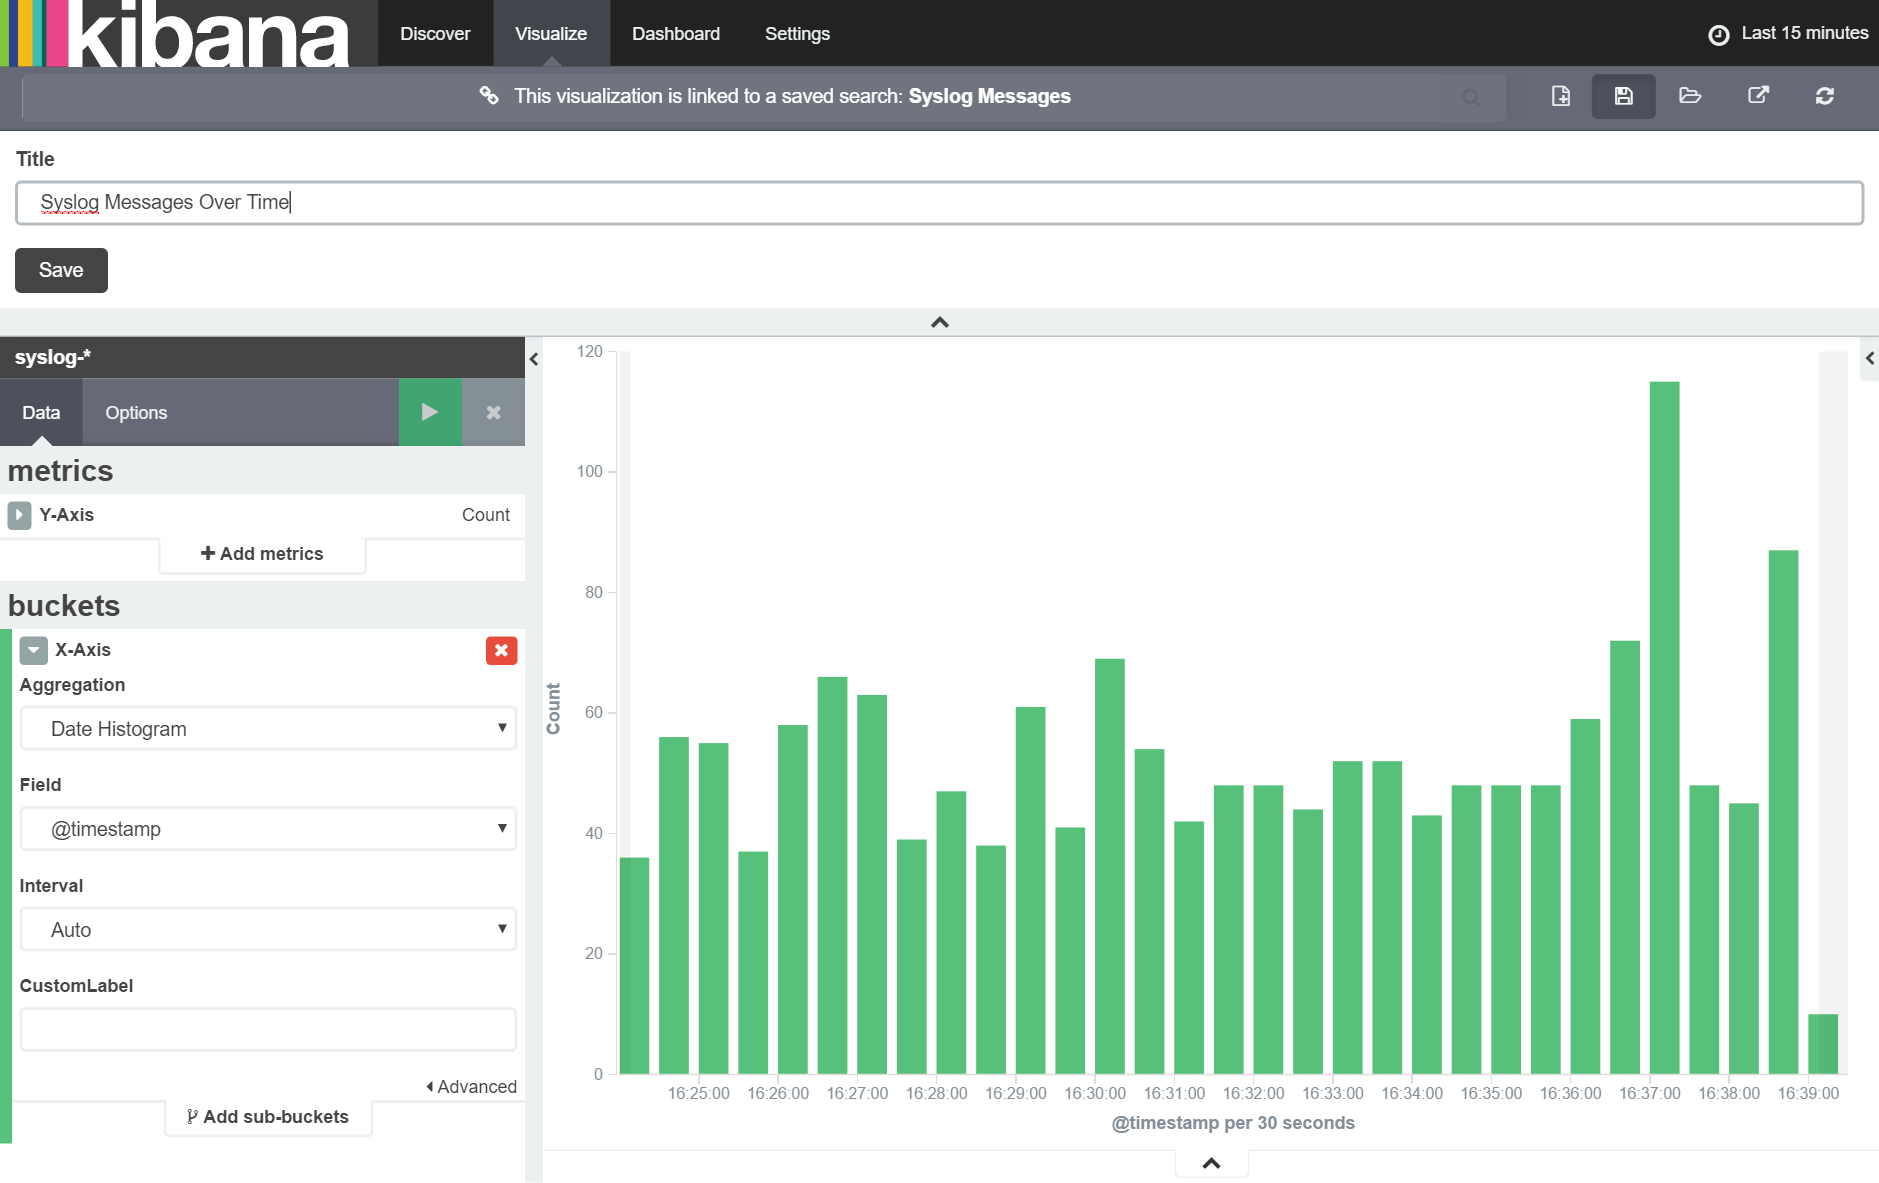
Next we navigate to the 'Dashboard' tab and click the '+' button as prompted. Again, we selected the visualization we just saved as shown below:
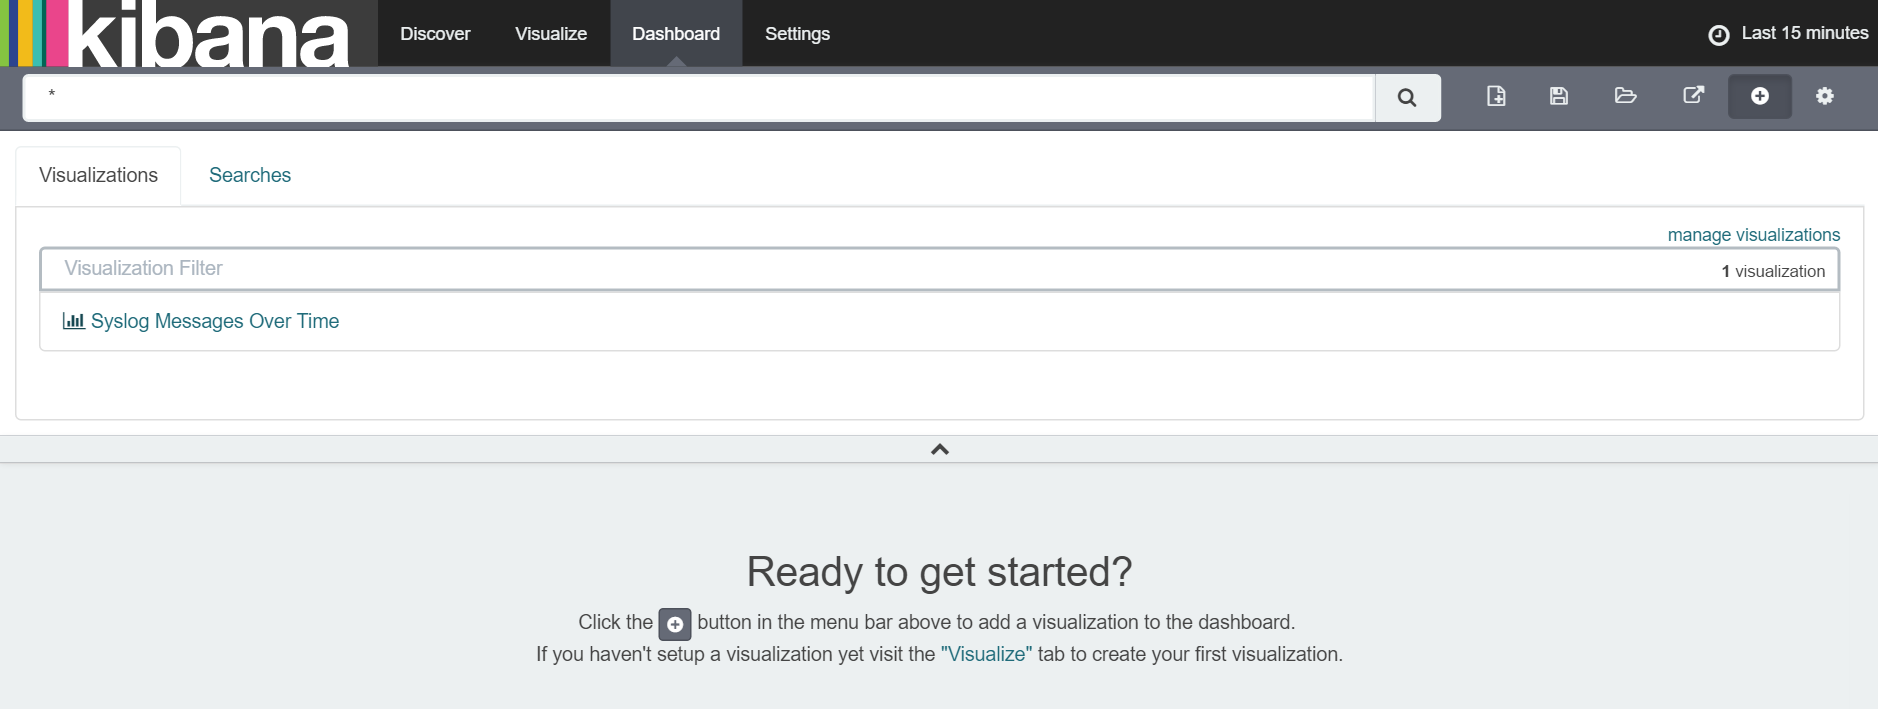
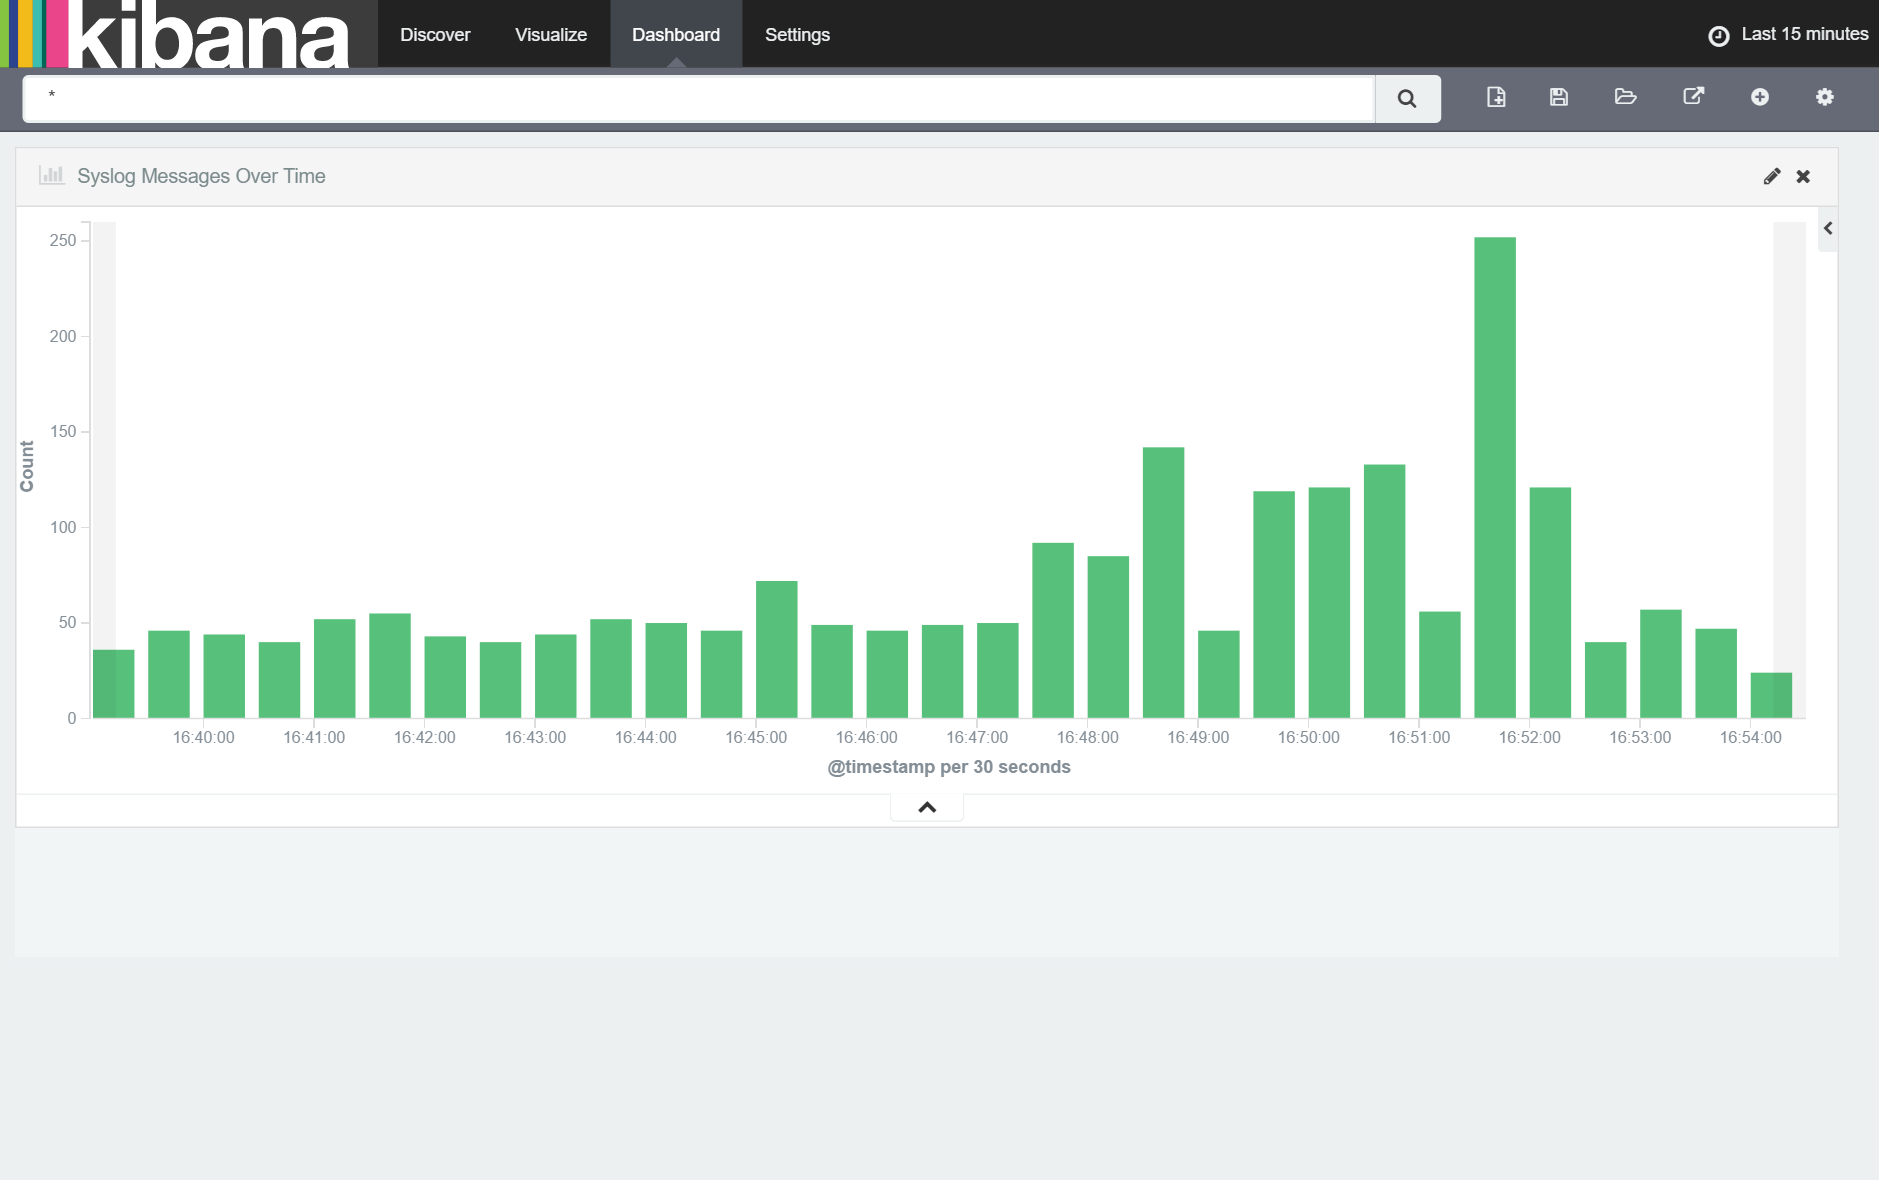
With the "Syslog Messages Over Time" visualization added, we make it a usable size by dragging the resize control (button right corner of the visualization) to extend the visualization across the width of the window as shown below:
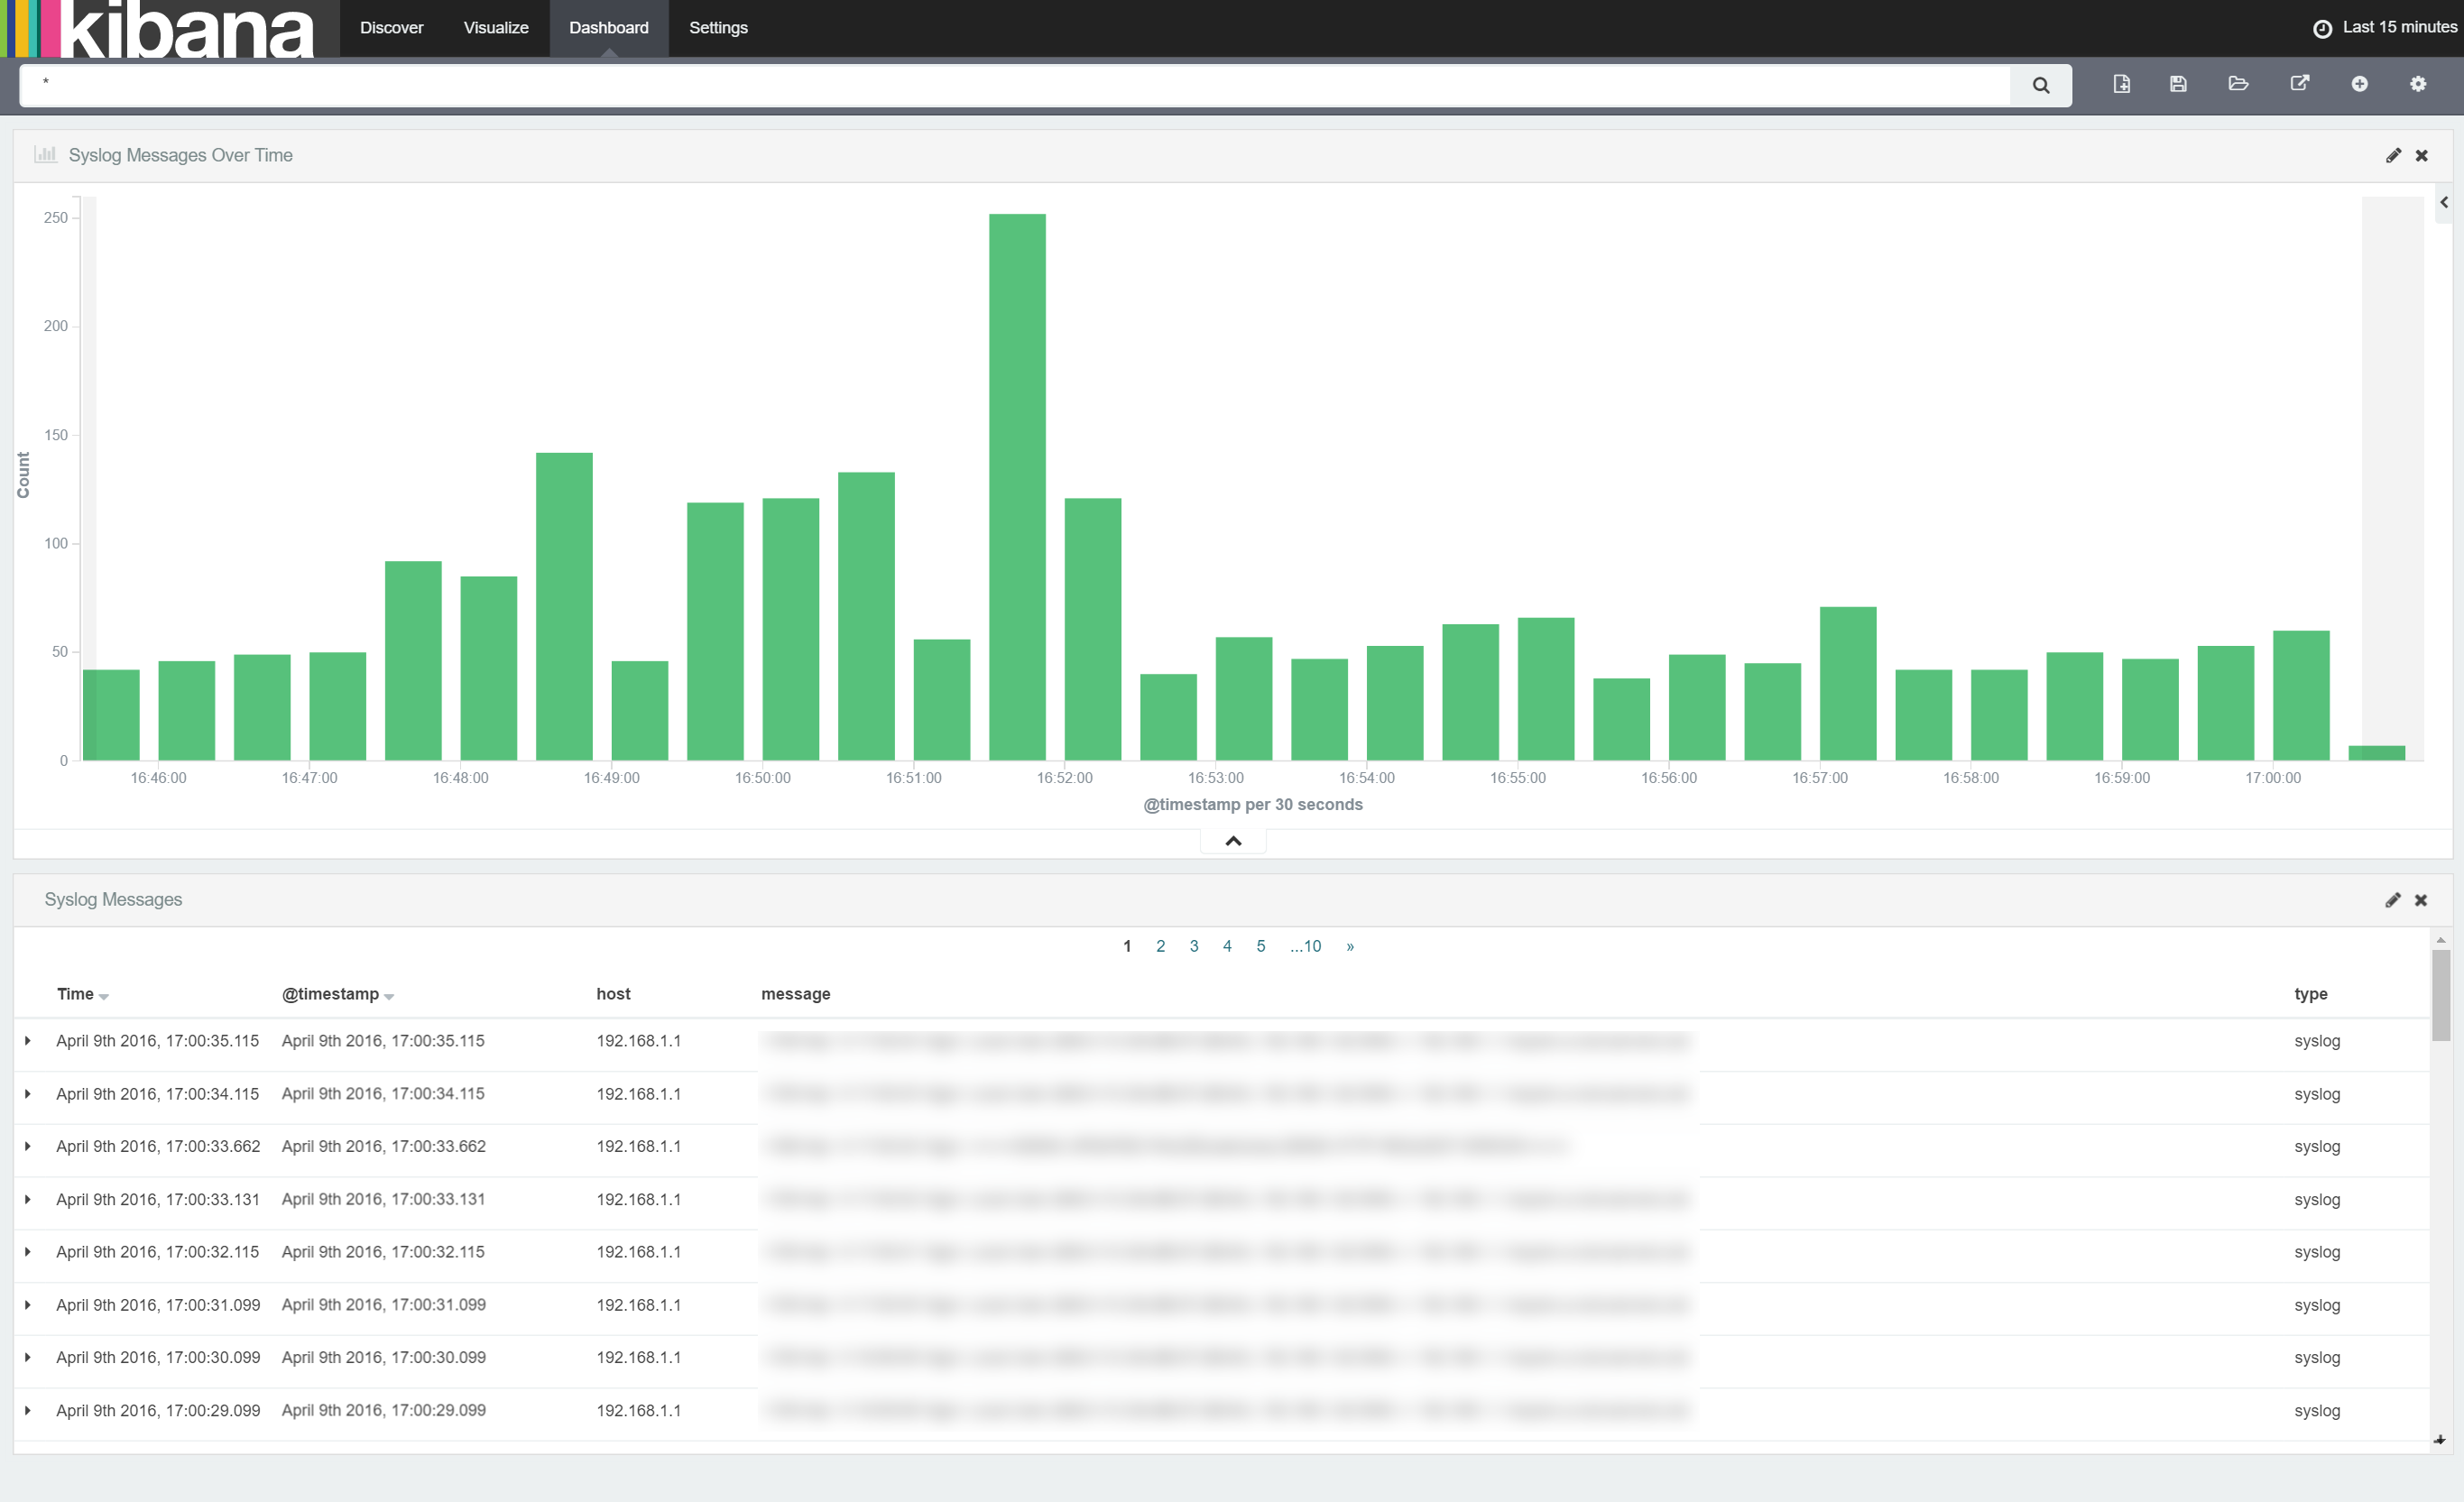
Finally, to make it easier to see the messages the histogram refers to, we'll add a table of related Syslog messages onto our dashboard below the histogram. To do this, click the '+' button, selected 'Searches' and then our 'Syslog Messages' search. When the table is added to the dashboard, make it a similar size as the histogram as shown below:
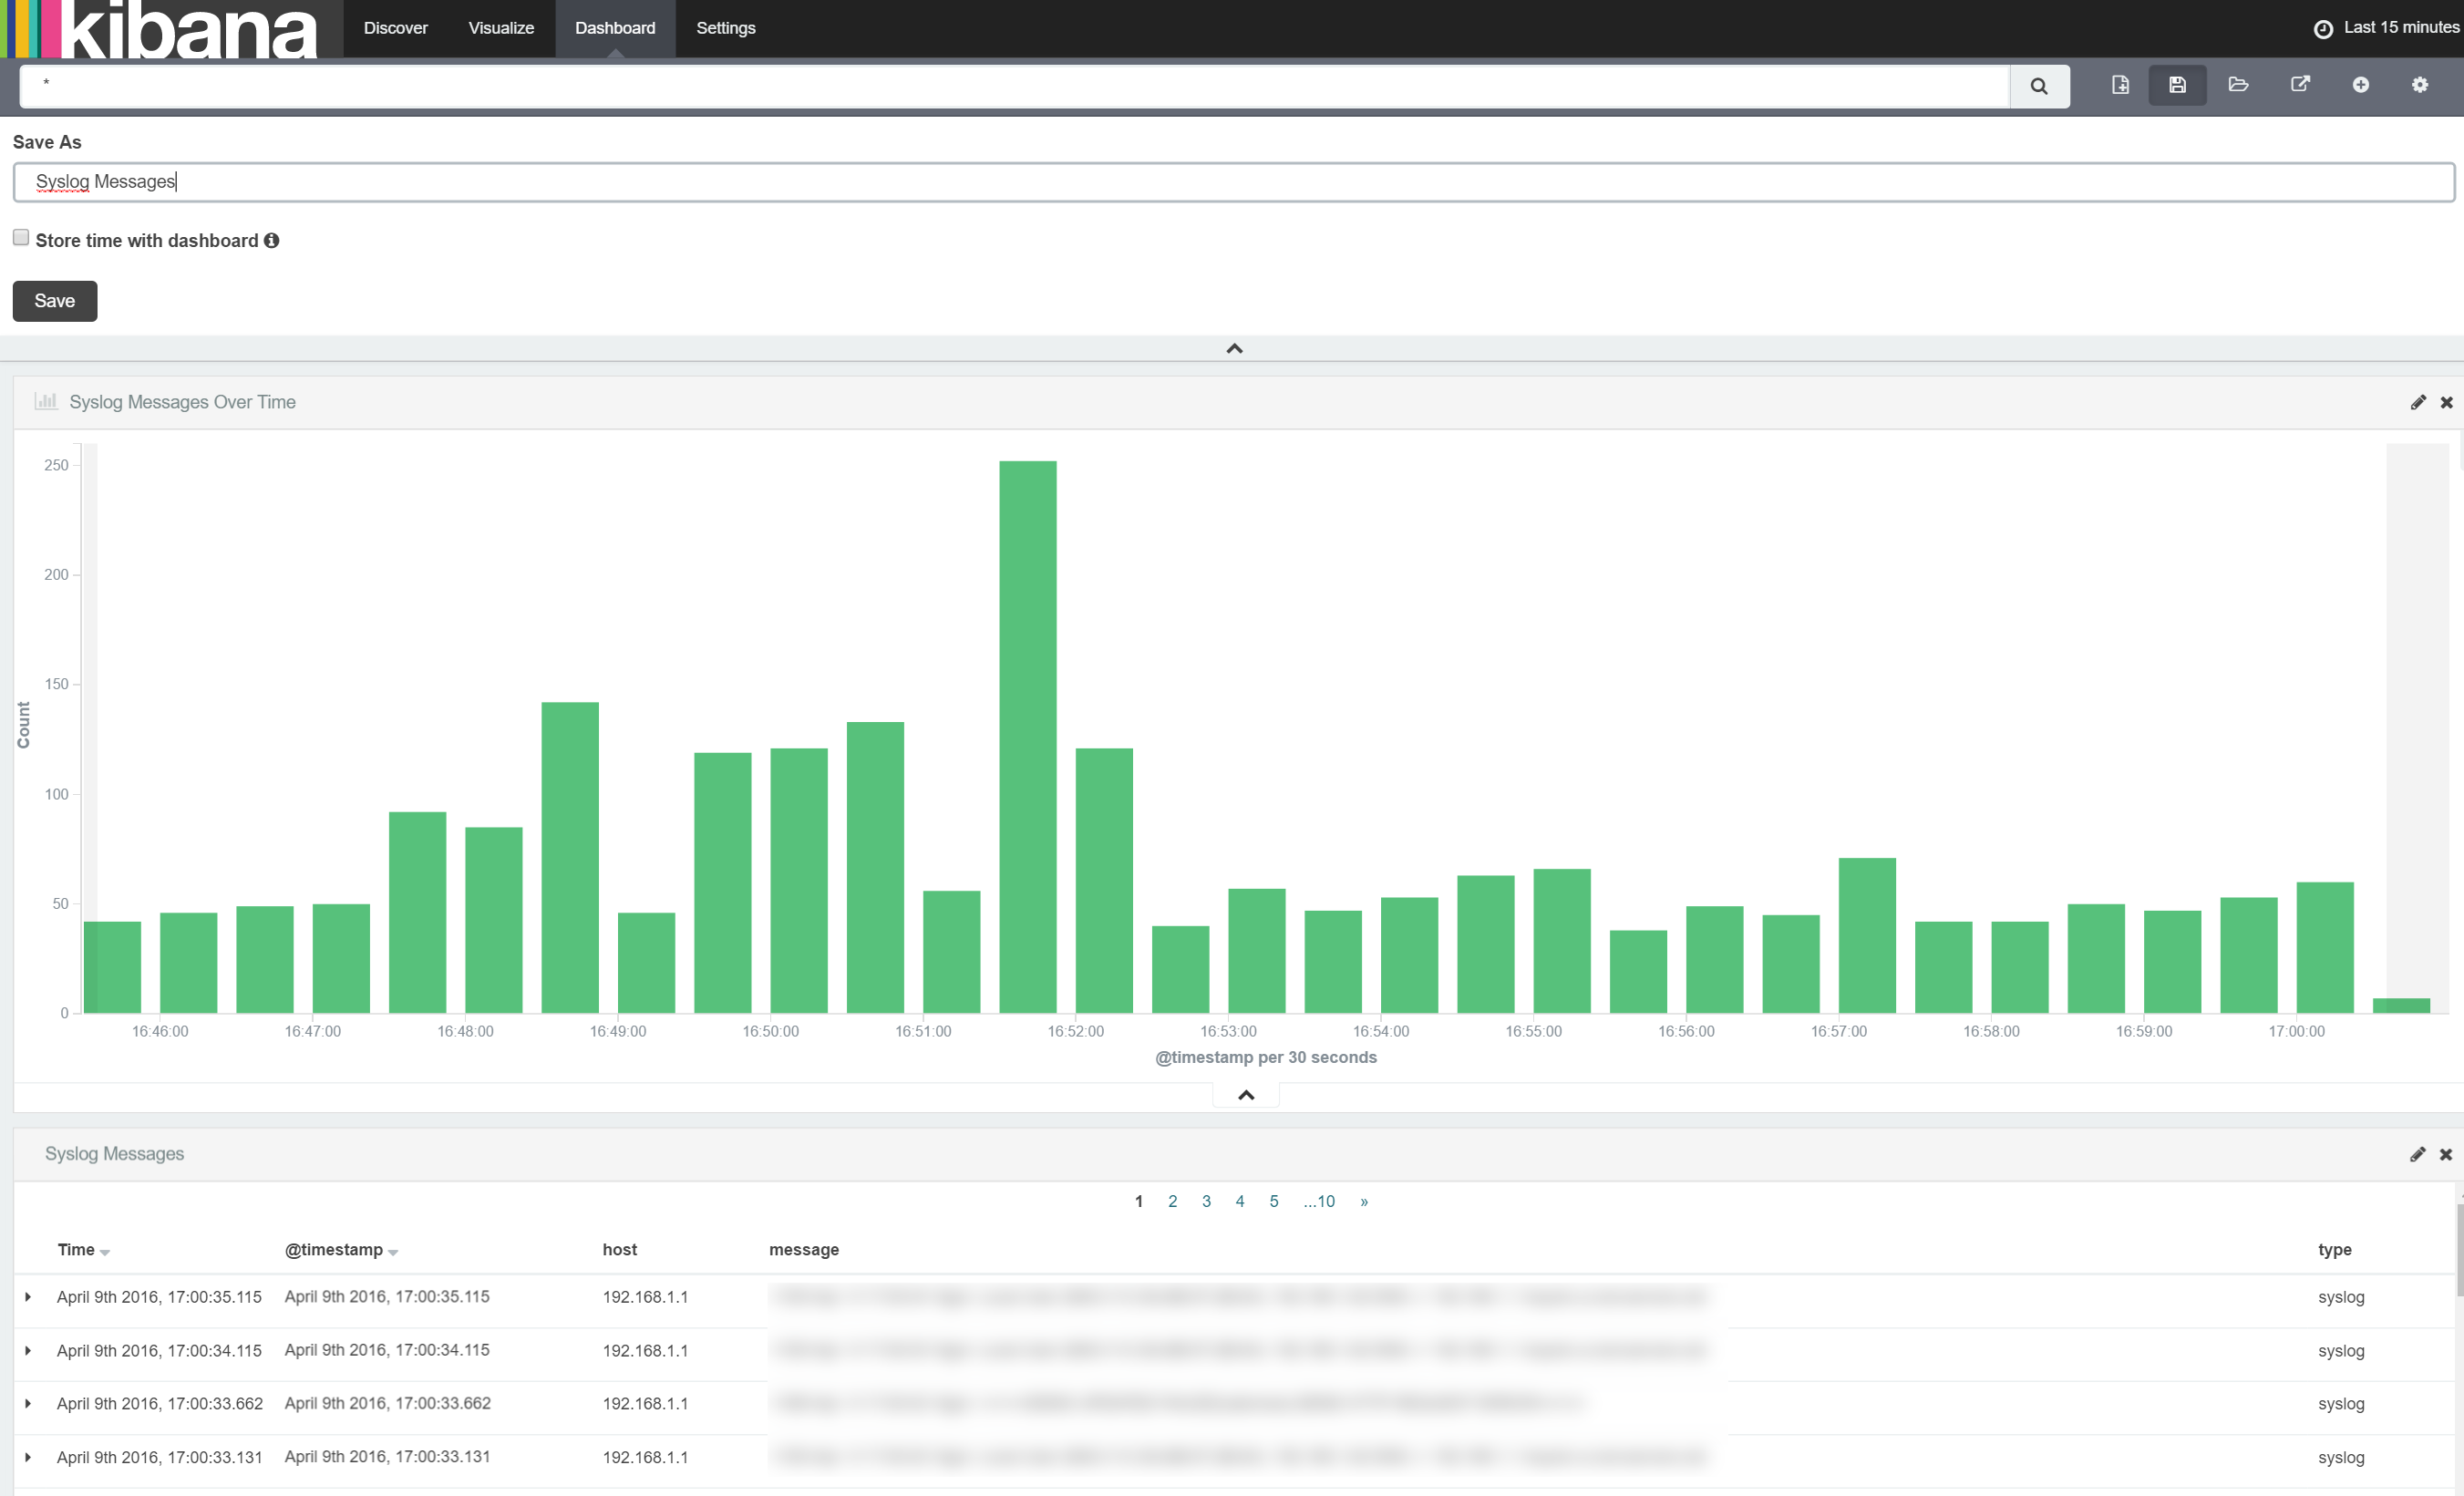
Once done, we need to save the dashboard so we can reload it any time we need it. Simply click the 'Save Dashboard' button as shown below:
Once saved you can bookmark the page and get back to your dashboard any time you like. Furthermore, once saved, you can monkey with the dashboard (explore the data by highlighting various areas of the chart, change time frames, set autorefresh etc) as much as you like knowing you can return to saved version any time.
summary
In this post, I have outlined how to use a Syslog capable router to send Syslog messages to Logstash and have Logstash store these messages in ElasticSearch for querying. Furthermore we then created a dashboard in which we can explore the number of Syslog messages we received over various timeframes.
In the next post we'll increase the granularity of the messages we store so that we can start creating more interesting dashboard.